
 資料結構
資料結構 網路
網路 RDBMS
RDBMS 作業系統
作業系統 Java
Java iOS
iOS HTML
HTML CSS
CSS Android
 Python
 C 程式設計
 C++
C++ C#
C# MongoDB
 MySQL
MySQL Javascript
 PHP
PHP如何在 Matplotlib 餅圖中顯示實際值?
要在 Matplotlib 餅圖中顯示實際值或任何自定義值,我們可以按照以下步驟操作 -
- 設定圖示尺寸並調整各個子圖之間的內填充和外填充。
- 列出標籤、分數、偏移位置,並求出分數的總和以計算出百分比
- 使用標籤、分數和帶有autopct=lambda p: <百分比計算>的偏移製作餅圖。
- 要顯示該圖形,請使用show()方法。
示例
import matplotlib.pyplot as plt
plt.rcParams["figure.figsize"] = [7.50, 3.50]
plt.rcParams["figure.autolayout"] = True
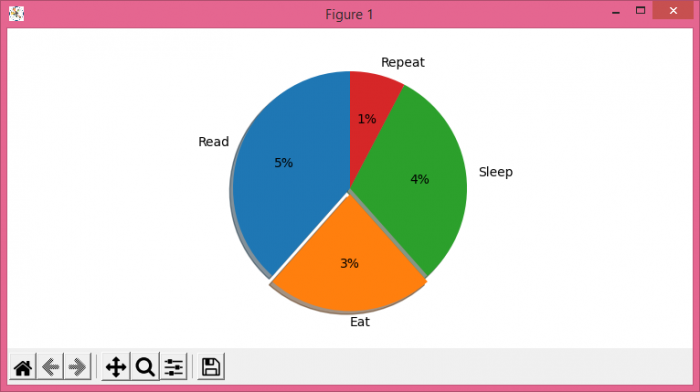
labels = ('Read', 'Eat', 'Sleep', 'Repeat')
fracs = [5, 3, 4, 1]
total = sum(fracs)
explode = (0, 0.05, 0, 0)
plt.pie(fracs, explode=explode, labels=labels,
autopct=lambda p: '{:.0f}%'.format(p * total / 100),
shadow=True, startangle=90)
plt.show()輸出

更新於:2021 年 6 月 17 日
7K+ 檢視

廣告