
 資料結構
資料結構 網路
網路 關係資料庫管理系統 (RDBMS)
 作業系統
作業系統 Java
Java iOS
iOS HTML
HTML CSS
CSS Android
 Python
 C語言程式設計
 C++
C++ C#
C# MongoDB
 MySQL
MySQL Javascript
 PHP
PHP如何使用Scikit-learn生成用於雙聚類的陣列?
在本教程中,我們將學習如何使用 Python Scikit-learn (Sklearn) 生成具有恆定塊對角結構和塊棋盤結構的陣列,用於雙聚類。
生成具有恆定塊對角結構的陣列
要生成具有恆定塊對角結構的雙聚類陣列,我們可以採取以下步驟:
步驟 1 − 匯入 sklearn.datasets.make_biclusters 和 matplotlib。
步驟 2 − 設定圖形大小
步驟 3 − 建立資料點,即資料、行和列。
步驟 4 − 建立一個繪圖器來顯示具有恆定塊對角結構的陣列。
步驟 5 − 提供標題。
示例
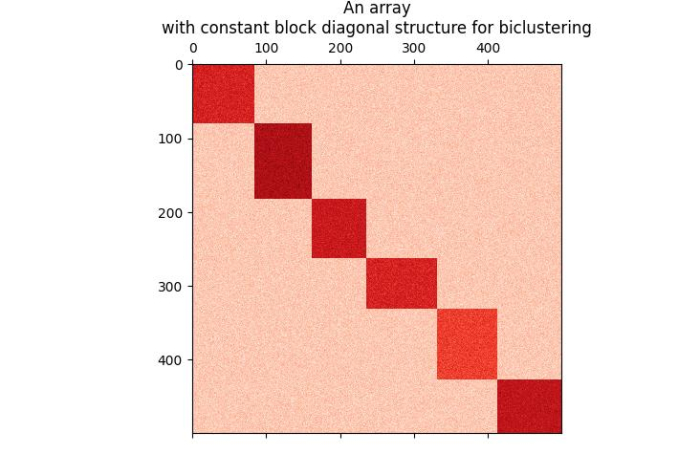
在下面給出的示例中,我們將生成一個形狀為 (500, 500) 且具有 6 個叢集的陣列。
# Importing libraries
from sklearn.datasets import make_biclusters

# Matplotlib for plotting the array with constant diagonal structure
from matplotlib import pyplot as plt

# Set the figure size
plt.rcParams["figure.figsize"] = [7.50, 3.50]
plt.rcParams["figure.autolayout"] = True

# Creating the bi-cluster Test Datasets using sklearn.datasets.make_biclusters

data, rows, columns = make_biclusters(
   shape=(500, 500), n_clusters=6, noise=5, shuffle=False, random_state=0
)
plt.matshow(data, cmap=plt.cm.Reds)

plt.title("An array\nwith constant block diagonal structure for biclustering")

plt.show()
輸出
它將產生以下輸出:
生成具有塊棋盤結構的陣列
要生成具有塊棋盤結構的雙聚類陣列,我們可以採取以下步驟:
步驟 1 − 匯入庫 sklearn.datasets.make_checkerboard 和 matplotlib。
步驟 2 − 設定圖形大小
步驟 3 − 建立資料點,即資料、行和列
步驟 4 − 建立一個繪圖器來顯示具有恆定塊對角結構的陣列。
步驟 5 − 提供標題。
示例
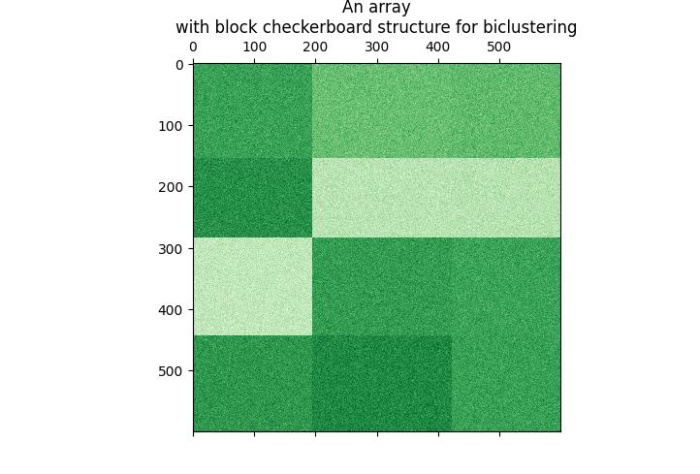
在下面給出的示例中,我們將生成一個形狀為 (600, 600) 且叢集數為 (4, 3) 的陣列。
# Importing libraries
from sklearn.datasets import make_checkerboard

# Matplotlib for plotting the array with block chekerboard structure
from matplotlib import pyplot as plt

# Set the figure size
plt.rcParams["figure.figsize"] = [7.50, 3.50]
plt.rcParams["figure.autolayout"] = True

# Creating the Test Datasets using sklearn.datasets.make_checkerboard

n_clusters = (4, 3)
data, rows, columns = make_checkerboard(
   shape=(600, 600), n_clusters=n_clusters, noise=10, shuffle=False, random_state=0
)
plt.matshow(data, cmap=plt.cm.Greens)

plt.title("An array\nwith block checkerboard structure for biclustering")

plt.show()
輸出
它將產生以下輸出:

更新於:2022年10月4日
353 次瀏覽

廣告