
 資料結構
資料結構 網路
網路 RDBMS
RDBMS 作業系統
作業系統 Java
Java iOS
iOS HTML
HTML CSS
CSS Android
 Python
 C 程式設計
 C++
C++ C#
C# MongoDB
 MySQL
MySQL Javascript
 PHP
PHP在 R 中建立直方圖時,該如何處理使用 `bins = 30` 時的警告訊息 `stat_bin()`?透過 `binwidth` 選擇更好的值。
bins 的預設值是 30,但是如果我們不將其傳遞給 geom_histogram 那麼 R 會在大多數情況下顯示警告訊息。為了避免這種情況,我們可以簡單地在 geom_histogram() 函式中放置 bins=30。這將停止顯示警告訊息。
請考慮下面這個資料框 −
x<-rnorm(50000,5,1)
df<-data.frame(x)
載入 ggplot2 包並建立 x 的直方圖 −
範例
library(ggplot2) ggplot(df,aes(x))+geom_histogram() `stat_bin()` using `bins = 30`. Pick better value with `binwidth`.
輸出
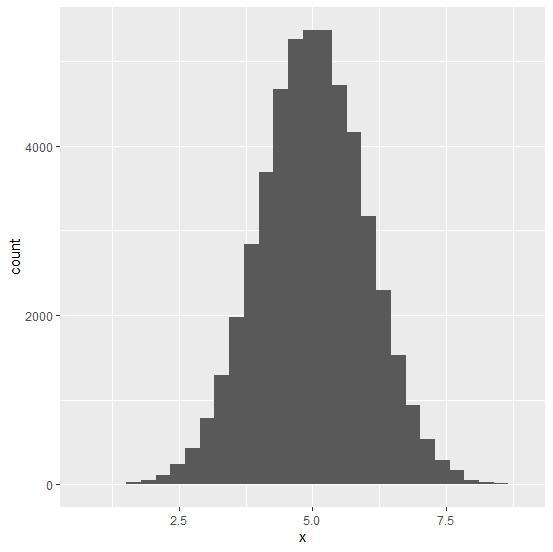
透過指定 bins 建立直方圖 −
範例
ggplot(df,aes(x))+geom_histogram(bins=30)
輸出


更新於:18-Oct-2020
7 千次瀏覽

廣告