
 資料結構
資料結構 網路
網路 RDBMS
RDBMS 作業系統
作業系統 Java
Java iOS
iOS HTML
HTML CSS
CSS Android
 Python
 C 語言
C 語言 C++
C++ C#
C# MongoDB
 MySQL
MySQL Javascript
 PHP
PHP如何在 matplotlib 中避免重疊誤差棒?
為了避免 matplotlib 中重疊的誤差棒,我們可以採取以下步驟——
步驟
設定圖形大小並調整子圖間和周圍的邊距。
建立名稱列表。
獲得 y1 和 y2、誤差 ye1、ye2 的資料點。
建立一個圖形和一組子圖。
建立一個可變 2D 仿射變換 trans1 和 trans2。
以帶有附加誤差棒的線和/或標記形式繪製 y 針對 x。
要顯示圖形,請使用 show() 方法。
示例
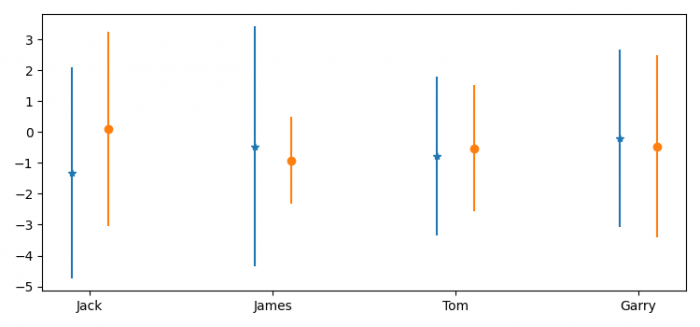
import numpy as np
import matplotlib.pyplot as plt
from matplotlib.transforms import Affine2D

plt.rcParams["figure.figsize"] = [7.50, 3.50]
plt.rcParams["figure.autolayout"] = True

x = ['Jack', 'James', 'Tom', 'Garry']

y1, y2 = np.random.randn(2, len(x))

ye1, ye2 = np.random.rand(2, len(x))*4+0.3

fig, ax = plt.subplots()

trans1 = Affine2D().translate(-0.1, 0.0) + ax.transData
trans2 = Affine2D().translate(0.1, 0.0) + ax.transData

er1 = ax.errorbar(x, y1, yerr=ye1, marker="*", linestyle="none", transform=trans1)
er2 = ax.errorbar(x, y2, yerr=ye2, marker="o", linestyle="none", transform=trans2)

plt.show()
輸出
它將生成以下輸出——

更新於:2022 年 2 月 02 日
2 千 + 檢視

廣告