
 資料結構
資料結構 網路
網路 關係型資料庫管理系統
 作業系統
作業系統 Java
Java iOS
iOS HTML
HTML CSS
CSS Android
 Python
 C 程式設計
 C++
C++ C#
C# MongoDB
 MySQL
MySQL Javascript
 PHP
PHP如何在 Python 的 Matplotlib 中獲取當前圖形編號?
在本文中,我們將學習如何在 Python 的 matplotlib 中獲取當前圖形編號。
Matplotlib 是一個 Python 庫,它是 NumPy 庫的一個數值數學擴充套件。Pyplot 是 Matplotlib 模組的一個基於狀態的介面,它提供了類似 MATLAB 的功能。Pyplot 中提供了線圖、等高線圖、直方圖、散點圖、3D 圖等多種繪圖方式。
使用 plt.gcf().number
什麼是 plt.gcf()
matplotlib.pyplot.gcf() 函式主要用於獲取當前圖形。如果當前沒有圖形,則使用 figure() 函式生成一個。
matplotlib.pyplot.gcf()
演算法(步驟)
以下是執行所需任務的演算法/步驟:
從 matplotlib 匯入 pyplot。
Pyplot is a Matplotlib module that offers a MATLAB-style interface.
Matplotlib is intended to be as user-friendly as MATLAB, but with
the added benefit of being free and open-source. Each pyplot function
alters a figure in some way, such as creating a figure, creating a
plotting area in a figure, plotting some lines in a plotting area,
decorating the plot with labels, and so on. Pyplot supports the following
plot types: Line Plot, Histogram, Scatter, 3D Plot, Image, Contour, and Polar
使用 import 關鍵字匯入 numpy。
使用 arange() 函式獲取從 0.1 到 2 的值範圍(NumPy arange() 是一個基於數值範圍的陣列建立例程。它建立一個具有等間距值的 ndarray 例項,並返回對它的引用)。
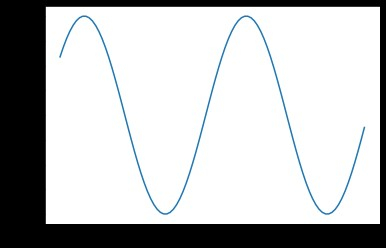
獲取上面建立的 numpy 陣列的正弦值並將其儲存在一個變數中,並將正弦值乘以 2。
獲取上面建立的 numpy 陣列的正弦值並將其儲存在一個變數中,並將正弦值乘以 4 以顯示差異。
使用 pyplot 建立一個圖形,並將圖形數量作為引數傳遞給 figure() 函式(函式 plt.figure() 用於建立圖形物件。圖形物件被認為是整個圖形。當我們想要更改圖形大小或在單個圖形中新增多個 Axes 物件時,必須顯式使用 plt.figure())。
使用 plot() 函式建立圖形(要在圖表中繪製點(標記),請使用 plot() 函式。預設情況下,plot() 函式繪製從點到點的線。該函式接受用於指定圖表點的引數。第一個引數是 x 軸點的陣列。引數 2 是包含 y 軸點的陣列)。這裡我們取 arange 值作為 x 軸,正弦值作為 y 軸。
使用不同的正弦值建立另一個圖形。
使用 plt.gcf() 函式的 number 屬性獲取當前圖形編號。
列印當前圖形編號。
使用 show() 函式顯示圖形(plt.show() 啟動事件迴圈,搜尋所有當前活動的圖形物件,並在一個或多個互動式視窗中顯示圖形)。
以下程式使用 **plt.gcf().number** 返回 Python 的 matplotlib 中的當前圖形編號:
# Importing pyplot from matplotlib as plt using the alias(as) keyword
from matplotlib import pyplot as plt
import numpy as np

# Taking sine values as numpy array
t = np.arange(0.1, 2.0)

# Sine curves
sineValues1 = np.sin(2*np.pi*t)
sineValues2 = np.sin(4*np.pi*t)

# Creating a numpy figure
plt.figure(1)

# Plotting the figure by passing sine curve values
plt.plot(t, sineValues1)

# Creating second numpy figure
plt.figure(2)

# Plotting the second figure by passing another sine curve values
plt.plot(t, sineValues2)

# Getting the current Figure number using gcf().number attribute
currentFigureNumber = plt.gcf().number

# Printing current figure number
print("Current Figure Number: ", currentFigureNumber)

# Showing the plots
plt.show()
輸出
執行上述程式後,將生成以下輸出:
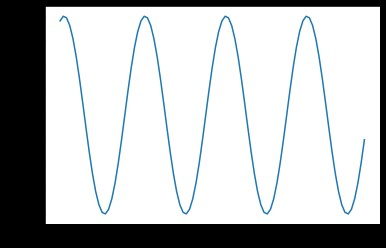
因為我們最近建立了第二個圖形,所以當前工作圖形為 2。
注意
您還可以使用文字字串而不是數字建立圖形,例如 plt.figure("first")。在圖形之間切換時,這可能比數字更容易記住。但是,plt.gcf().number 返回整數“1”,表示它是一個自動編號系統。
結論
在本文中,我們學習瞭如何在 matplotlib 中獲取當前圖形編號。我們還學習了什麼是 matplotlib、如何在繪圖時建立圖形、如何使用 gcf() 函式獲取圖形等等。

3K+ 閱讀量
