
 資料結構
資料結構 網路
網路 RDBMS
RDBMS 作業系統
作業系統 Java
Java iOS
iOS HTML
HTML CSS
CSS Android
 Python
 C 程式設計
 C++
C++ C#
C# MongoDB
 MySQL
MySQL JavaScript
 PHP
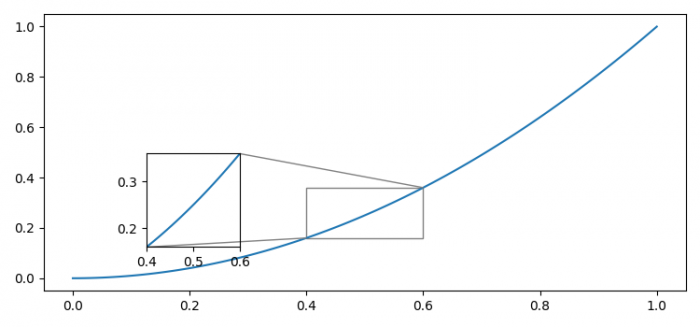
PHPMatplotlib 中縮放嵌入影像的不同 X 和 Y 刻度
若要在 Matplotlib 中縮放嵌入影像的不同 X 和 Y 刻度,我們可以使用 inset_axes() 方法。
步驟
- 設定圖形大小並調整子圖的間距和周圍的邊距。
- 使用 numpy 建立 x 和 y 資料點。
- 將子圖新增到當前圖形。
- 使用 plot() 方法繪製 x 和 y 資料點。
- 建立具有指定寬度和高度的嵌入式座標軸。
- 設定不同的 x 和 y 刻度。
- 繪製一個框來標記嵌入式座標軸表示的區域的位置。
- 要顯示圖形,請使用 show() 方法。
示例
import matplotlib.pyplot as plt
import numpy as np
from mpl_toolkits.axes_grid1.inset_locator import mark_inset, inset_axes

plt.rcParams["figure.figsize"] = [7.50, 3.50]
plt.rcParams["figure.autolayout"] = True

x = np.linspace(0, 1, 100)
y = x ** 2

ax = plt.subplot(1, 1, 1)
ax.plot(x, y)

axins = inset_axes(ax, 1, 1, loc=2, bbox_to_anchor=(0.2, 0.55),
                  bbox_transform=ax.figure.transFigure)
axins.plot(x, y)

x1, x2 = .4, .6
y1, y2 = x1 ** 2, x2 ** 2

axins.set_xlim(x1, x2)
axins.set_ylim(y1, y2)

mark_inset(ax, axins, loc1=1, loc2=3, fc="none", ec="0.5")

plt.show()
輸出

更新於: 2021-06-17
1000+ 訪問

廣告