- D3.js 教程
- D3.js - 首頁
- D3.js - 簡介
- D3.js - 安裝
- D3.js - 概念
- D3.js - 選擇器
- D3.js - 資料連線
- D3.js - SVG 簡介
- D3.js - SVG 變換
- D3.js - 過渡
- D3.js - 動畫
- D3.js - 繪製圖表
- D3.js - 圖表
- D3.js - 地理資料
- D3.js - 陣列 API
- D3.js - 集合 API
- D3.js - 選擇器 API
- D3.js - 路徑 API
- D3.js - 比例尺 API
- D3.js - 軸 API
- D3.js - 形狀 API
- D3.js - 顏色 API
- D3.js - 過渡 API
- D3.js - 拖拽 API
- D3.js - 縮放 API
- D3.js - 請求 API
- 分隔符分隔值 API (Delimiter-Separated Values API)
- D3.js - 定時器 API
- D3.js - 工作示例
- D3.js 有用資源
- D3.js - 快速指南
- D3.js - 有用資源
- D3.js - 討論
D3.js - 圖表
圖表是一個二維平面空間,表示為矩形。圖表具有座標空間,其中 x = 0 和 y = 0 座標位於左下角。根據數學笛卡爾座標系,圖表的 X 座標從左到右遞增,Y 座標從下到上遞增。
當我們談論繪製一個座標為 x = 30 和 y = 30 的圓時,我們從左下角向右移動 30 個單位,然後向上移動 30 個單位。
SVG 座標空間
SVG 座標空間的工作方式與數學圖表座標空間相同,但有兩個重要區別:
- SVG 座標空間的 x = 0 和 y = 0 座標位於左上角。
- SVG 座標空間的 Y 座標從上到下遞增。
SVG 座標空間圖表
當我們在 SVG 座標空間中談論繪製一個座標為 x = 30 和 y = 30 的圓時,我們從左上角向右移動 30 個單位,然後向下移動 30 個單位。定義如下。
var svgContainer = d3
   .select("body")
   .append("svg")
   .attr("width", 200)
   .attr("height", 200);
考慮一個寬度為 200 個單位,高度為 200 個單位的 SVG 元素作為圖表。我們現在知道 X 和 Y 的零座標位於左上角。我們現在也知道,隨著 Y 座標的增加,它將從圖表的頂部移動到底部。您可以如下所示設定 SVG 元素的樣式。
var svgContainer = d3
   .select("body").append("svg")
   .attr("width", 200)
   .attr("height", 200)
   .style("border", "1px solid black");
圖表示例
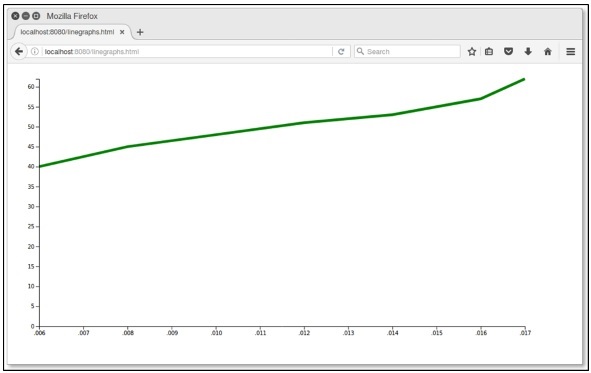
讓我們考慮一個折線圖的例子。
折線圖 - 折線圖用於視覺化某事物隨時間的變化值。它比較兩個變數。每個變數都沿一個軸繪製。折線圖有一個垂直軸和一個水平軸。
在這個示例圖表中,我們可以使用 2006 年至 2017 年印度各邦人口增長的 csv 檔案記錄。讓我們首先建立一個 data.csv 檔案來顯示人口記錄。
在您的 D3 資料夾中建立一個新的 csv 檔案:
year,population
2006,40
2008,45
2010,48
2012,51
2014,53
2016,57
2017,62
現在,儲存檔案並執行以下步驟以在 D3 中繪製折線圖。讓我們詳細介紹每個步驟。
步驟 1 - 新增樣式 - 讓我們使用下面給出的程式碼為 line 類新增樣式。
.line {
   fill: none;
   stroke: green;
   stroke-width: 5px;
}
步驟 2 - 定義變數 - SVG 屬性定義如下。
var margin = {top: 20, right: 20, bottom: 30, left: 50},
   width = 960 - margin.left - margin.right,
   height = 500 - margin.top - margin.bottom;
這裡,第一行定義了四個邊距,它們圍繞著圖表所在塊。
步驟 3 - 定義線條 - 使用下面顯示的 d3.line() 函式繪製新線條。
var valueline = d3.line()
   .x(function(d) { return x(d.year); })
   .y(function(d) { return y(d.population); });
這裡,Year 代表 X 軸記錄中的資料,population 代表 Y 軸中的資料。
步驟 4 - 新增 SVG 屬性 - 使用下面的程式碼新增 SVG 屬性和分組元素。
var svg = d3.select("body").append("svg")
   .attr("width", width + margin.left + margin.right)
   .attr("height", height + margin.top + margin.bottom)
   .append("g").attr("transform",
      "translate(" + margin.left + "," + margin.top + ")");
在這裡,我們添加了分組元素並應用了變換。
步驟 5 - 讀取資料 - 現在,我們可以從我們的資料集 data.csv 中讀取資料。
d3.csv("data.csv", function(error, data) {
   if (error) throw error;
}
這裡,data.csv 不存在,會報錯。
步驟 6 - 格式化資料 - 現在,使用下面的程式碼格式化資料。
data.forEach(function(d) {
   d.year = d.year;
   d.population = +d.population;
});
以上程式碼確保從 csv 檔案中提取的所有值都被正確設定和格式化。每一行包含兩個值:一個“year”值和一個“population”值。該函式一次一行地提取“year”和“population”的值。
步驟 7 - 設定比例尺範圍 - 資料格式化後,您可以設定 X 和 Y 的比例尺範圍。
x.domain(d3.extent(data, function(d) { return d.year; }));
y.domain([0, d3.max(data, function(d) { return d.population; })]);
步驟 8 - 新增路徑 - 新增路徑和資料,如下所示。
svg.append("path").data([data])
   .attr("class", "line").attr("d", valueline);
步驟 9 - 新增 X 軸 - 現在,您可以使用下面的程式碼新增 X 軸。
svg.append("g")
   .attr("transform", "translate(0," + height + ")")
   .call(d3.axisBottom(x));
步驟 10 - 新增 Y 軸 - 我們可以如下所示向組中新增 Y 軸。
svg.append("g")
   .call(d3.axisLeft(y));
步驟 11 - 工作示例 - 下面的程式碼塊給出了完整的程式碼。建立一個簡單的網頁 linegraphs.html 並新增以下更改。
graph.html
<!DOCTYPE html>
<html>
   <head>
      <script type = "text/javascript" src = "https://d3js.org/d3.v4.min.js"></script>
      <style>
         .line {
            fill: none;
            stroke: green;
            stroke-width: 5px;
         }
      </style>
   </head>

   <body>
      <script>
         // set the dimensions and margins of the graph
         var margin = {top: 20, right: 20, bottom: 30, left: 50},
         width = 960 - margin.left - margin.right,
         height = 500 - margin.top - margin.bottom;

         // set the ranges
         var x = d3.scaleTime().range([0, width]);
         var y = d3.scaleLinear().range([height, 0]);

         // define the line
         var valueline = d3.line()
            .x(function(d) { return x(d.year); })
            .y(function(d) { return y(d.population); });

         // append the svg obgect to the body of the page
         // appends a 'group' element to 'svg'
         // moves the 'group' element to the top left margin
         var svg = d3.select("body").append("svg")
            .attr("width", width + margin.left + margin.right)
            .attr("height", height + margin.top + margin.bottom)
            .append("g").attr("transform",
               "translate(" + margin.left + "," + margin.top + ")");

         // Get the data
         d3.csv("data.csv", function(error, data) {
            if (error) throw error;
            // format the data
            data.forEach(function(d) {
               d.year = d.year;
               d.population = +d.population;
            });

            // Scale the range of the data
            x.domain(d3.extent(data, function(d) { return d.year; }));
            y.domain([0, d3.max(data, function(d) { return d.population; })]);

            // Add the valueline path.
            svg.append("path")
               .data([data])
               .attr("class", "line")
               .attr("d", valueline);

            // Add the X Axis
            svg.append("g")
               .attr("transform", "translate(0," + height + ")")
               .call(d3.axisBottom(x));

            // Add the Y Axis
            svg.append("g")
               .call(d3.axisLeft(y));
         });
      </script>
   </body>
</html>
現在請求瀏覽器,我們將看到以下結果。