
 資料結構
資料結構 網路
網路 關係資料庫管理系統 (RDBMS)
 作業系統
作業系統 Java
Java iOS
iOS HTML
HTML CSS
CSS Android
 Python
 C語言程式設計
 C++
C++ C#
C# MongoDB
 MySQL
MySQL Javascript
 PHP
PHP使用Python實現康威生命遊戲?
大約在1970年,一位英國數學家創造了他的“生命遊戲”——它實際上是一套規則,描述了生物有機體群落混亂而有規律的生長。“生命遊戲”是一個二維網格,由“活”細胞和“死”細胞組成。
生命遊戲的規則
**過度繁殖:** 如果一個細胞周圍有超過三個活細胞,則該細胞死亡。
**穩定:** 如果一個細胞周圍有兩個或三個活細胞,則該細胞存活。
**人口不足:** 如果一個細胞周圍少於兩個活細胞,則該細胞死亡。
**繁殖:** 如果一個死細胞周圍恰好有三個活細胞,則該細胞活過來。
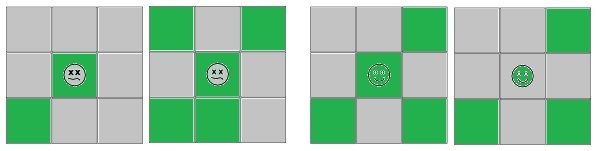
![]() 細胞將在下一個時間步長死亡
細胞將在下一個時間步長死亡
![]() 細胞將在下一個時間步長存活
細胞將在下一個時間步長存活
![]() 細胞存活
細胞存活
![]() 細胞死亡
細胞死亡
透過按順序步驟應用上述規則,我們將得到美麗而意想不到的圖案。
實現步驟
i. Initialise an empty universe
ii. Fill the universe with the seed
iii. Calculate if the current cell survives to the next timestamps, based on its neighbours
iv. Repeat this survival function(like step-iii) over all the cells in the universe neighbours.
v. Repeat steps iii-iv for the desired number of generations.
安裝
要建立康威生命遊戲,我們將使用matplotlib和numpy陣列庫。要安裝numpy和matplolib,請使用pip -
$pip install numpy, matplolib
實現康威生命遊戲的程式
現在是時候根據我們上述規則編寫程式了。以下是實現生命遊戲的程式:
#Import required library

import numpy as np
import matplotlib.pyplot as plt

import argparse
import time

#-------------------------------------------------------------------------
class Board(object):
   def __init__(self, size, seed = 'Random'):
      if seed == 'Random':
         self.state = np.random.randint(2, size = size)
      self.engine = Engine(self)
      self.iteration = 0
   def animate(self):
      i = self.iteration
      im = None
      plt.title("Conway's Game of Life")
      while True:
         if i == 0:
            plt.ion()
            im = plt.imshow(self.state, vmin = 0, vmax = 2, cmap = plt.cm.gray)
         else:
            im.set_data(self.state)
         i += 1
         self.engine.applyRules()
         print('Life Cycle: {} Birth: {} Survive: {}'.format(i, self.engine.nBirth, self.engine.nSurvive))
         plt.pause(0.01)
         yield self

#-------------------------------------------------------------------------

class Engine(object):
   def __init__(self, board):
      self.state = board.state
   def countNeighbors(self):
      state = self.state
      n = (state[0:-2,0:-2] + state[0:-2,1:-1] + state[0:-2,2:] +
          state[1:-1,0:-2] + state[1:-1,2:] + state[2:,0:-2] +
          state[2:,1:-1] + state[2:,2:])
      return n
   def applyRules(self):
      n = self.countNeighbors()
      state = self.state
      birth = (n == 3) & (state[1:-1,1:-1] == 0)
      survive = ((n == 2) | (n == 3)) & (state[1:-1,1:-1] == 1)
      state[...] = 0
      state[1:-1,1:-1][birth | survive] = 1
      nBirth = np.sum(birth)
      self.nBirth = nBirth
      nSurvive = np.sum(survive)
      self.nSurvive = nSurvive
   return state

#-------------------------------------------------------------------------

def main():
   ap = argparse.ArgumentParser(add_help = False) # Intilialize Argument Parser
   ap.add_argument('-h', '--height', help = 'Board Height', default = 256)
   ap.add_argument('-w', '--width', help = 'Board Width', default = 256)
   args = vars(ap.parse_args()) # Gather Arguments
   bHeight = int(args['height'])
   bWidth = int(args['width'])
   board = Board((bHeight,bWidth))
   for _ in board.animate():
      pass
#-------------------------------------------------------------------------

if __name__ == '__main__':
   main()
輸出
Console:
Life Cycle: 1 Birth: 7166 Survive: 10621
Life Cycle: 2 Birth: 7930 Survive: 8409
Life Cycle: 3 Birth: 7574 Survive: 8756
Life Cycle: 4 Birth: 7114 Survive: 8406
Life Cycle: 5 Birth: 7005 Survive: 8126
Life Cycle: 6 Birth: 6644 Survive: 7926
Life Cycle: 7 Birth: 6266 Survive: 7711
Life Cycle: 8 Birth: 6132 Survive: 7427
Life Cycle: 9 Birth: 5957 Survive: 7322
Life Cycle: 10 Birth: 5769 Survive: 7290
Life Cycle: 11 Birth: 5585 Survive: 6937
Life Cycle: 12 Birth: 5381 Survive: 6791
Life Cycle: 13 Birth: 5208 Survive: 6686
Life Cycle: 14 Birth: 5063 Survive: 6563
….
…
上述結果將持續出現,直到我們在終端中按下Ctrl-C以停止程式。
圖形顯示
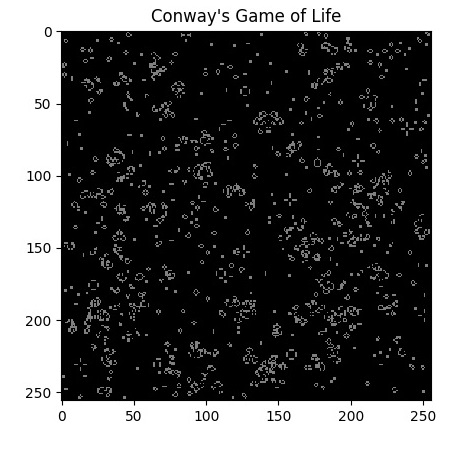
細胞將不斷變化,並將模擬非常美麗的圖案。
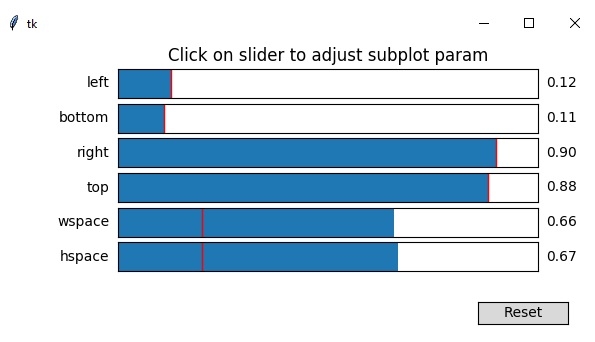
您可以透過更改設定和更改滑塊值來更改上述子圖。

更新於:2019年7月30日
504 次瀏覽

廣告