
 資料結構
資料結構 網路
網路 關係資料庫管理系統 (RDBMS)
 作業系統
作業系統 Java
Java iOS
iOS HTML
HTML CSS
CSS Android
 Python
 C語言程式設計
 C++
C++ C#
C# MongoDB
 MySQL
MySQL Javascript
 PHP
PHP使用NumPy計算nums針對bins的直方圖
在Python中,建立直方圖可以使用numpy、matplotlib和seaborn庫。在NumPy中,我們有名為histogram()的函式來處理直方圖資料。histogram()函式的輸入引數是nums和bins。nums用於建立數值資料。
在繼續示例之前,讓我們首先了解什麼是直方圖。
什麼是直方圖
直方圖是資料集分佈的圖形表示。它以一系列條形圖的形式表示資料,其中每個條形圖代表資料值的範圍,條形圖的高度代表在該範圍內定義的資料值的頻率。
它們主要用於表示數值資料的分佈,例如班級成績、人口分佈或員工收入分佈等。
使用Python中的NumPy計算直方圖
在直方圖中,x軸表示資料值的範圍,分為若干區間;y軸表示每個區間內資料值的頻率。透過將每個區間的頻率除以總資料值,可以對直方圖進行歸一化處理,得到相對頻率直方圖,其中y軸表示每個區間的數值。
語法
以下是為給定資料範圍和nums建立直方圖的語法。
numpy.histogram(nums, bins, range, normed, weights, density)
其中:
nums是輸入數值資料。
bins是圖表中表示資料的條形圖數量。
range定義直方圖中的值範圍。
normed支援density引數。
weights是可選引數,為每個資料值加權。
Density引數用於將直方圖資料歸一化以形成機率密度。
示例
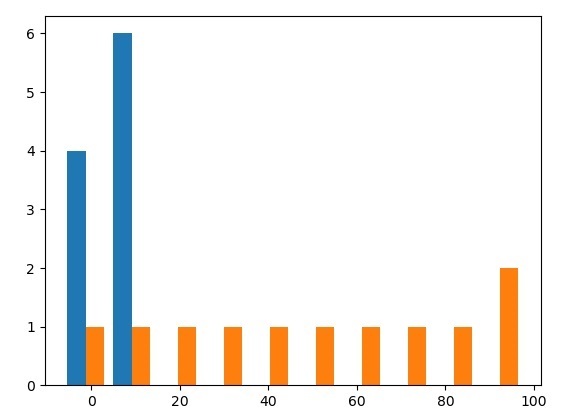
在下面的示例中,我們透過定義nums和直方圖中需要的bins數量來建立學生的成績。histogram()函式透過將nums和bins作為輸入引數來生成直方圖。
import numpy as np
import matplotlib.pyplot as plt
nums = np.random.normal(50,20,size = 50)
hist = np.histogram(nums)
print("The histogram of the given data:",hist)
plt.hist(hist)
plt.show()
輸出
以下是使用nums針對bins的histogram()函式的輸出。
The histogram of the given data: (array([ 1,  0,  0,  6,  7,  9,  8, 12,  4,  3]), array([-11.52097959,  -1.64606252,   8.22885455,  18.10377162,
        27.97868869,  37.85360576,  47.72852282,  57.60343989,
        67.47835696,  77.35327403,  87.2281911 ]))
示例
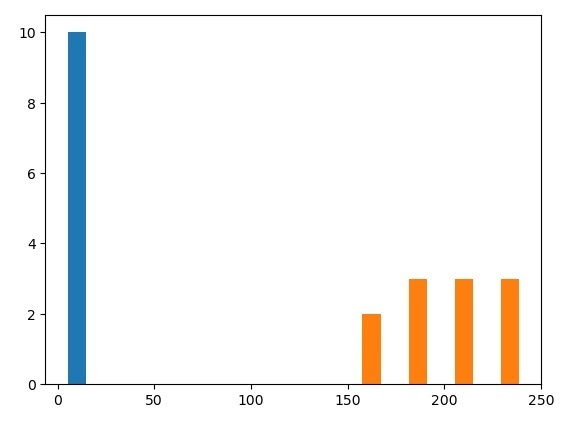
讓我們看另一個示例來了解使用nums針對bins的histogram()的工作原理。
import numpy as np
import matplotlib.pyplot as plt
nums = np.random.normal(200,20,size = 100)
hist = np.histogram(nums)
print("The histogram of the given data:",hist)
plt.hist(hist)
plt.show()
輸出
以下是使用nums針對bins的histogram()函式的輸出。
The histogram of the given data: (array([ 2,  1,  8, 17, 18, 24, 13, 11,  3,  3]), array([146.40363927, 156.62124167, 166.83884407, 177.05644647,
       187.27404887, 197.49165127, 207.70925367, 217.92685607,
       228.14445847, 238.36206086, 248.57966326]))
示例
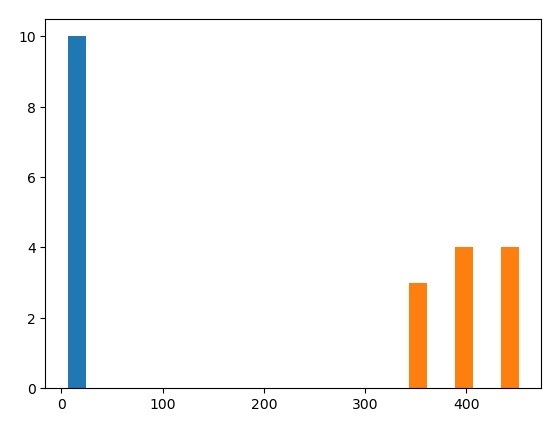
讓我們看另一個示例來使用numpy庫的histogram()函式處理nums針對bins的資料。
import numpy as np
import matplotlib.pyplot as plt
nums = np.random.normal(400,30,size = 30)
hist = np.histogram(nums)
print("The histogram of the given data:",hist)
plt.hist(hist)
plt.show()
輸出
以下是使用nums針對bins的histogram()函式的輸出。
The histogram of the given data: (array([2, 1, 3, 5, 5, 4, 6, 0, 2, 2]), array([340.28832063, 352.48676341, 364.68520618, 376.88364896,
       389.08209174, 401.28053451, 413.47897729, 425.67742007,
       437.87586284, 450.07430562, 462.2727484 ]))

瀏覽量:100
