
 資料結構
資料結構 網路
網路 關係型資料庫管理系統
 作業系統
作業系統 Java
Java iOS
iOS HTML
HTML CSS
CSS Android
 Python
 C 語言
C 語言 C++
C++ C#
C# MongoDB
 MySQL
MySQL Javascript
 PHP
PHP在 Matplotlib 中自動定位文字框
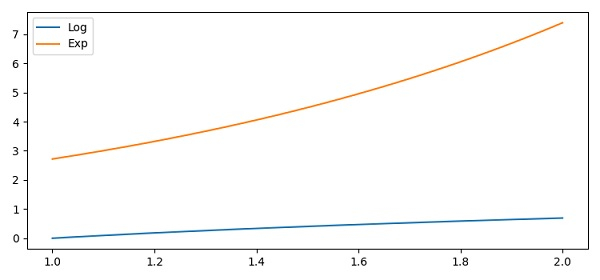
要在 matplotlib 中自動定位文字框,我們可以執行以下步驟:
從 1 到 2 以及 100 個樣本中建立xpoints 。
使用 xpoints(步驟 1)和 numpy 建立 y1points 和 y2points。
使用 plot() 方法繪製xpoints、y1points 和 y2points 。
要設定標籤,請使用 legend() 方法。它有助於定位文字框。
要顯示圖形,請使用 show() 方法。
示例
import numpy as np
from matplotlib import pyplot as plt
plt.rcParams["figure.figsize"] = [7.50, 3.50]
plt.rcParams["figure.autolayout"] = True
xpoints = np.linspace(1, 2, 100)
y1points = np.log(xpoints)
y2points = np.exp(xpoints)
plt.plot(xpoints, y1points, label="Log")
plt.plot(xpoints, y2points, label="Exp")
plt.legend()
plt.show()
輸出

更新於:2021-04-09
635 次瀏覽

廣告