
 資料結構
資料結構 網路
網路 RDBMS
RDBMS 作業系統
作業系統 Java
Java iOS
iOS HTML
HTML CSS
CSS Android
 Python
 C 程式設計
 C++
C++ C#
C# MongoDB
 MySQL
MySQL Javascript
 PHP
PHPMatplotlib 中帶換行符的文字框
Matplotlib 可以自動換行文字,但如果文字太長,它將顯示在軸邊界外。
步驟
使用 figure() 建立新圖形,或啟用現有圖形。
使用 plt.axis() 方法設定軸屬性。
建立一個變數 input_text 來儲存字串。
使用 plt.text() 方法向圖形新增文字,其中 style='oblique', ha='center', va='top',...等。
使用 plt.show() 方法顯示圖形。
示例
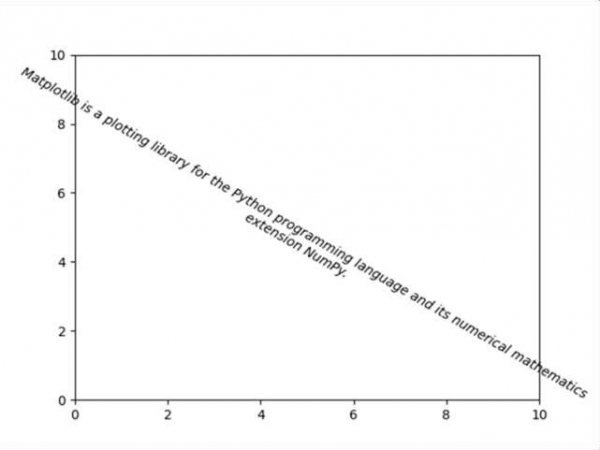
import matplotlib.pyplot as plt

fig = plt.figure()
plt.axis([0, 10, 0, 10])
input_text = 'Matplotlib is a plotting library for the Python programming
language and its numerical mathematics extension NumPy.'
plt.text(5, 5, input_text, fontsize=10, style='oblique', ha='center', va='top', wrap=True, rotation=-30)

plt.show()
輸出

更新時間:17-Mar-2021
1K+ 瀏覽

廣告