
 資料結構
資料結構 網路
網路 關係型資料庫管理系統
 作業系統
作業系統 Java
Java iOS
iOS HTML
HTML CSS
CSS Android
 Python
 C 程式設計
 C++
C++ C#
C# MongoDB
 MySQL
MySQL Javascript
 PHP
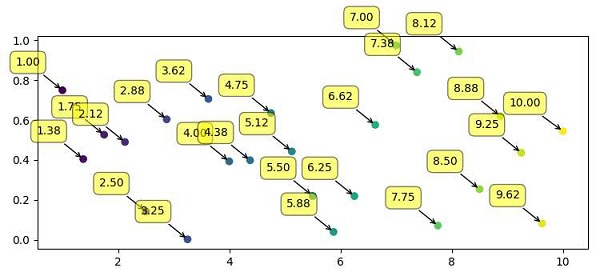
PHP用 matplotlib 在圖表上書寫數字值
要將數值寫在圖表上,我們可以採取以下步驟 −
使用 numpy 建立 x 和 y 的點。
使用 xpoints 建立標籤。
使用 scatter() 方法散佈點。
迭代 labels、xpoints 和 ypoints,並使用不同的屬性給圖表新增標籤、x 和 y 註釋。
要顯示圖表,請使用 show() 方法。
示例
import numpy as np
from matplotlib import pyplot as plt
plt.rcParams["figure.figsize"] = [7.50, 3.50]
plt.rcParams["figure.autolayout"] = True
xpoints = np.linspace(1, 10, 25)
ypoints = np.random.rand(25)
labels = ["%.2f" % i for i in xpoints]
plt.scatter(xpoints, ypoints, c=xpoints)
for label, x, y in zip(labels, xpoints, ypoints):
   plt.annotate(
      label,
      xy=(x, y), xytext=(-20, 20),
      textcoords='offset points', ha='right', va='bottom',
      bbox=dict(boxstyle='round,pad=0.5', fc='yellow', alpha=0.5),
      arrowprops=dict(arrowstyle='->', connectionstyle='arc3,rad=0'))
plt.show()
輸出

更新於: 2021 年 4 月 9 日
708 次瀏覽

廣告