
 資料結構
資料結構 網路
網路 RDBMS
RDBMS 作業系統
作業系統 Java
Java iOS
iOS HTML
HTML CSS
CSS Android
 Python
 C 程式設計
 C++
C++ C#
C# MongoDB
 MySQL
MySQL Javascript
 PHP
PHP在 Jupyter/iPython 中動態更新圖表的當前正確方法是什麼?
我們可以首先使用 plt.ion() 方法啟用圖片。然後,我們可以使用不同的值更新圖表。
步驟
使用子圖方法建立 fig 和 ax 變數,其中預設 nrows 和 ncols 為 1。
使用 plot() 方法繪製一條線。
設定線條顏色,即橙色。
使用 plt.ion() 方法啟用互動。
要使圖表具有互動性,請更改線條座標。
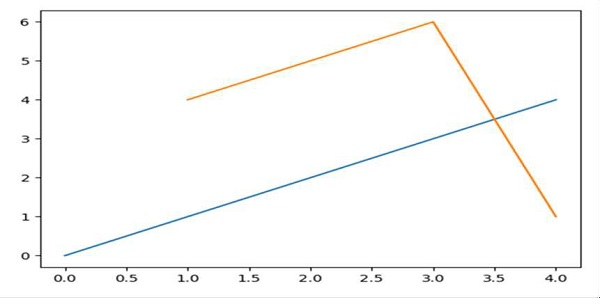
示例
In [1]: %matplotlib auto

Using matplotlib backend: GTK3Agg

In [2]: import matplotlib.pyplot as plt

# Diagram will get popped up. Let’s update the diagram.
In [3]: fig, ax = plt.subplots()

# Drawing a line
In [4]: ax.plot(range(5))

In [5]: plt.ion()

# updating figures with new lines.
In [6]: ax.plot([1, 3, 4], [4, 6, 1])
輸出

更新於: 16-Mar-2021
473 次瀏覽

廣告