
 資料結構
資料結構 網路
網路 關係型資料庫管理系統
 作業系統
作業系統 Java
Java iOS
iOS HTML
HTML CSS
CSS Android
 Python
 C 程式設計
 C++
C++ C#
C# MongoDB
 MySQL
MySQL Javascript
 PHP
PHP什麼是滯後閾值?如何使用 Python 中的 scikit-learn 實現它?
滯後指的是結果的滯後效應。關於閾值,滯後指的是**高於特定低閾值或高於高閾值的區域。它指的是**本質上高度自信的區域。
藉助滯後,可以忽略影像中物件邊緣外的噪聲。
讓我們看看如何使用 scikit-learn 庫實現滯後閾值
示例
import matplotlib.pyplot as plt
from skimage import data, filters
fig, ax = plt.subplots(nrows=2, ncols=2)
orig_img = data.coins()
edges = filters.sobel(orig_img)
low = 0.1
high = 0.4
lowt = (edges > low).astype(int)
hight = (edges > high).astype(int)
hyst = filters.apply_hysteresis_threshold(edges, low, high)
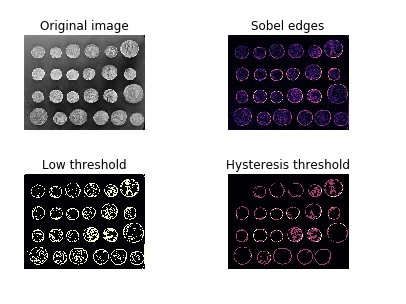
ax[0, 0].imshow(orig_img, cmap='gray')
ax[0, 0].set_title('Original image')
ax[0, 1].imshow(edges, cmap='magma')
ax[0, 1].set_title('Sobel edges')
ax[1, 0].imshow(lowt, cmap='magma')
ax[1, 0].set_title('Low threshold')
ax[1, 1].imshow(hight + hyst, cmap='magma')
ax[1, 1].set_title('Hysteresis threshold')
for a in ax.ravel():
a.axis('off')
plt.tight_layout()
plt.show()輸出
解釋
匯入所需的庫。
在控制檯上繪製圖像之前,使用 subplot 函式設定繪圖區域。
scikit-learn 包中已有的“coin”資料用作輸入。
使用“sobel”濾波器獲取輸入的“sobel”影像,其中在結果影像中強調邊緣
使用函式“apply_hysteresis_threshold”獲取高於和低於某個閾值的值。
使用函式“imshow”在控制檯上顯示此資料。

更新於: 2020-12-11
1K+ 次檢視

廣告