
 資料結構
資料結構 網路
網路 RDBMS
RDBMS 作業系統
作業系統 Java
Java iOS
iOS HTML
HTML CSS
CSS Android
 Python
 C 程式設計
 C++
C++ C#
C# MongoDB
 MySQL
MySQL Javascript
 PHP
PHPR 中 ggplot2 包中 geom_point 可用的點有哪些不同型別?
我們可以使用 ggplot2 包建立點圖,但是這些點不一定呈圓形,ggplot2 中為這些點提供了 25 種形狀選項。在使用 ggplot2 建立點圖時,我們可以在 geom_point 中使用 shape 引數檢視這 25 種形狀之間的差異。
示例
考慮以下資料幀
> set.seed(1957)
> x<-rnorm(10,1,0.38)
> y<-rnorm(10,1,0.67)
> df<-data.frame(x,y)
> df
輸出
       x       y
1 0.7028704 1.6664500
2 0.9672393 1.0456639
3 1.3102736 0.2495795
4 0.3389941 0.2141513
5 0.5867095 0.4417377
6 0.4257543 0.6533757
7 0.9106756 0.3611954
8 1.0444729 1.3770588
9 0.9151447 0.7225429
10 1.5207510 1.1613454
載入 ggplot2 包並使用 shape = 1 建立點圖
示例
> library(ggplot2)
> ggplot(df,aes(x,y))+geom_point(shape=1)
輸出

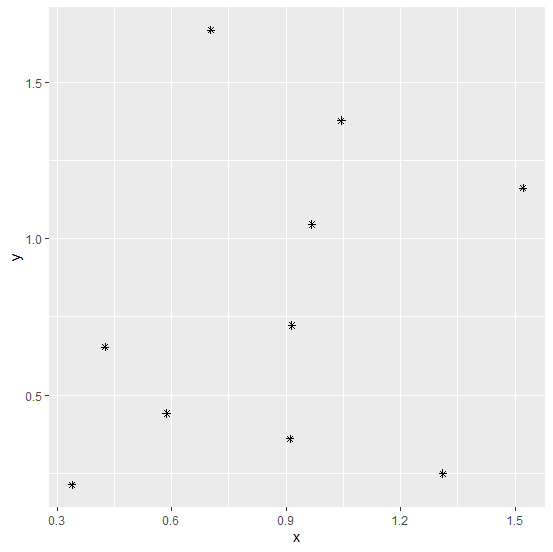
使用 shape = 8 建立點圖
示例
> ggplot(df,aes(x,y))+geom_point(shape=8)
輸出
使用 shape = 25 建立點圖
示例
> ggplot(df,aes(x,y))+geom_point(shape=25)
輸出

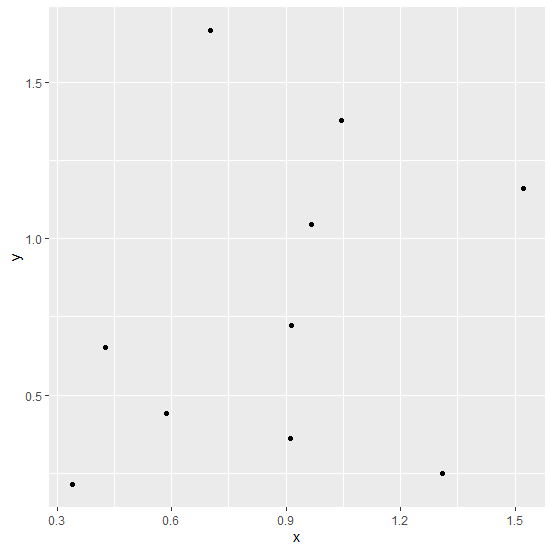
使用 shape = 16 建立點圖
示例
> ggplot(df,aes(x,y))+geom_point(shape=16)
輸出

更新於: 2020 年 11 月 21 日
201 次瀏覽

廣告