
 資料結構
資料結構 網路
網路 關係資料庫管理系統
 作業系統
作業系統 Java
Java iOS
iOS HTML
HTML CSS
CSS Android
 Python
 C 語言程式設計
 C++
C++ C#
C# MongoDB
 MySQL
MySQL Javascript
 PHP
PHPSeaborn 中有哪些不同的圖形樣式?
Seaborn 是 Python 中一個強大的資料視覺化庫,它提供了各種樣式來自定義繪圖的外觀。Seaborn 中內建的圖形樣式可以幫助我們自定義繪圖的外觀,並增強視覺化的美觀性。讓我們逐一探索 Seaborn 中可用的不同圖形樣式。
Seaborn 中有不同的圖形樣式,它們是:
預設樣式
深色網格樣式
白色網格樣式
深色樣式
白色樣式
刻度樣式
當我們想要在 Seaborn 中應用特定樣式時,可以使用 'set_style()' 函式。例如,要設定深色網格樣式,我們可以使用 'seaborn.set_style("darkgrid")'。預設情況下,樣式會應用於所有後續繪圖,但我們也可以使用 'with' 語句將特定樣式臨時應用於單個繪圖。
除了內建的圖形樣式外,Seaborn 還允許使用 'set()' 函式進一步自定義繪圖。使用 'set()',我們可以修改繪圖的各個方面,例如調色盤、字型大小和網格樣式,以滿足我們的偏好和需求。
預設樣式
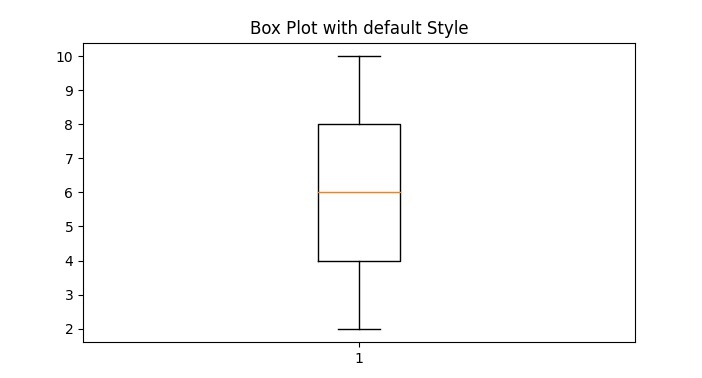
Seaborn 的預設樣式設計為視覺上具有吸引力並優化了可讀性。它具有簡潔現代的外觀,帶有中等灰色的網格線和白色背景。此樣式是在使用 Seaborn 建立繪圖時應用的預設樣式。
示例
以下是一個使用預設樣式建立 Seaborn 繪圖的示例:
import seaborn as sns
import matplotlib.pyplot as plt

# Generate some random data for plotting
x = [1, 2, 3, 4, 5]
y = [2, 4, 6, 8, 10]

# Plot a box plot using the ticks style
plt.boxplot(y)
plt.title("Box Plot with default Style")
plt.show()
輸出
深色網格樣式
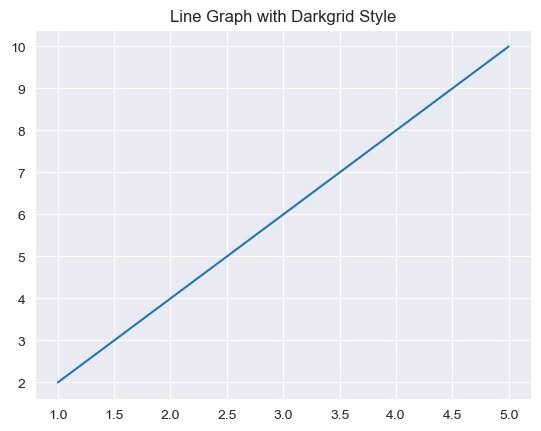
深色網格樣式的特點是深色背景和網格線。它適用於需要高對比度的繪圖,使資料更容易聚焦。此樣式透過設定深灰色背景顏色和淺灰色網格線來實現。
示例
以下是一個示例:
import seaborn as sns
import matplotlib.pyplot as plt

# Generate some random data for plotting
x = [1, 2, 3, 4, 5]
y = [2, 4, 6, 8, 10]

# Set the style to "darkgrid"
sns.set_style("darkgrid")

# Plot a line graph using the darkgrid style
plt.plot(x, y)
plt.title("Line Graph with Darkgrid Style")
plt.show()
輸出
白色網格樣式
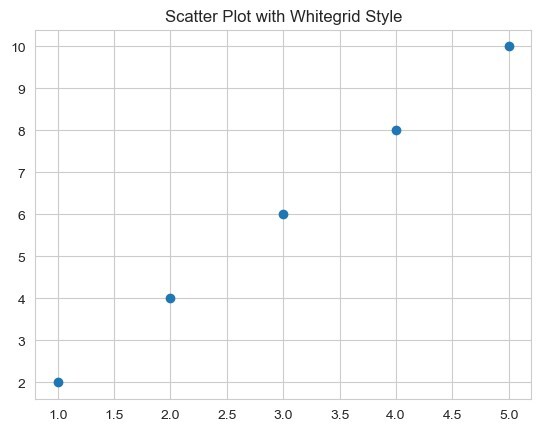
白色網格樣式類似於深色網格樣式,但具有白色背景。它將簡潔的外觀與網格線相結合,允許資料點之間清晰的視覺分離。當我們想要強調資料同時保持結構化佈局時,此樣式很有用。
示例
以下是一個示例:
import seaborn as sns
import matplotlib.pyplot as plt

# Generate some random data for plotting
x = [1, 2, 3, 4, 5]
y = [2, 4, 6, 8, 10]

# Set the style to "whitegrid"
sns.set_style("whitegrid")

# Plot a scatter plot using the whitegrid style
plt.scatter(x, y)
plt.title("Scatter Plot with Whitegrid Style")
plt.show()
輸出
深色樣式
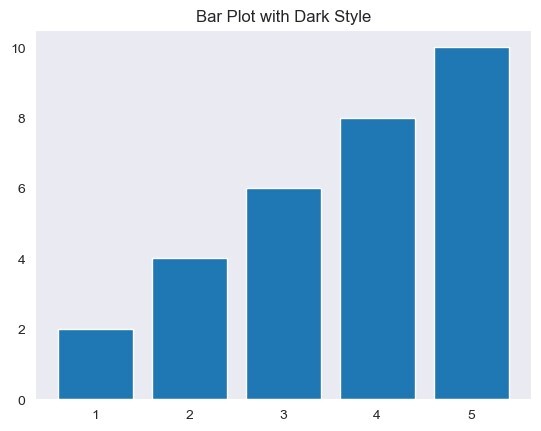
深色樣式提供深色背景,沒有網格線。它適用於建立具有現代和簡約外觀的繪圖。此樣式透過設定深灰色背景顏色並移除網格線來實現。
示例
在以下示例中,我們嘗試使用深色樣式建立 Seaborn 繪圖:
import seaborn as sns
import matplotlib.pyplot as plt

# Generate some random data for plotting
x = [1, 2, 3, 4, 5]
y = [2, 4, 6, 8, 10]

# Set the style to "dark"
sns.set_style("dark")

# Plot a bar plot using the dark style
plt.bar(x, y)
plt.title("Bar Plot with Dark Style")
plt.show()
輸出
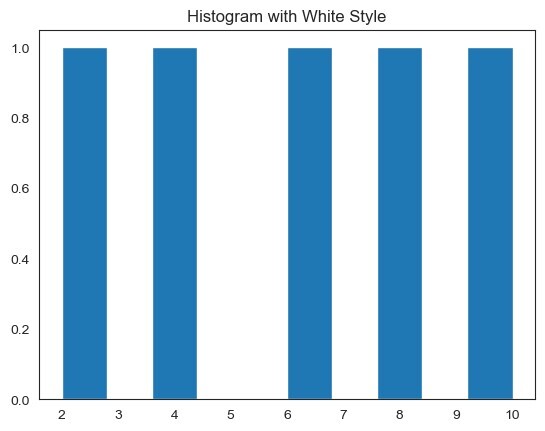
白色樣式
白色樣式具有白色背景,沒有網格線。它建立了一個簡單幹淨的外觀,適用於以資料本身為焦點的繪圖。此樣式透過設定白色背景顏色並移除網格線來實現。
示例
讓我們看一個例子:
import seaborn as sns
import matplotlib.pyplot as plt

# Generate some random data for plotting
x = [1, 2, 3, 4, 5]
y = [2, 4, 6, 8, 10]

# Set the style to "white"
sns.set_style("white")

# Plot a histogram using the white style
plt.hist(y)
plt.title("Histogram with White Style")
plt.show()
輸出
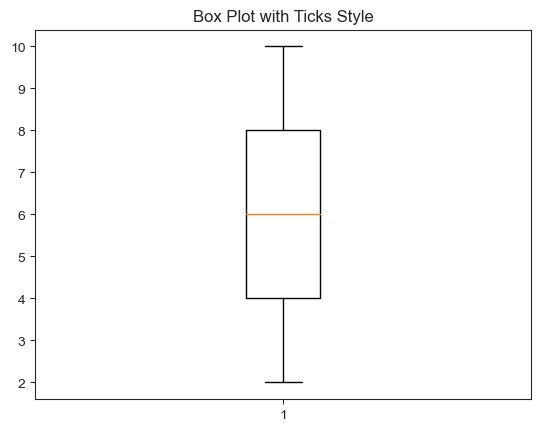
刻度樣式
刻度樣式會移除繪圖的頂部和右側脊柱,並且只保留剩餘脊柱上的刻度。此樣式透過減少雜亂來簡化繪圖的外觀,同時仍然提供必要的軸資訊。
示例
以下是一個示例:
import seaborn as sns
import matplotlib.pyplot as plt

# Generate some random data for plotting
x = [1, 2, 3, 4, 5]
y = [2, 4, 6, 8, 10]

# Set the style to "ticks"
sns.set_style("ticks")

# Plot a box plot using the ticks style
plt.boxplot(y)
plt.title("Box Plot with Ticks Style")
plt.show()
輸出

1K+ 閱讀量
