
 資料結構
資料結構 網路
網路 RDBMS
RDBMS 作業系統
作業系統 Java
Java iOS
iOS HTML
HTML CSS
CSS Android
 Python
 C 程式設計
 C++
C++ C#
C# MongoDB
 MySQL
MySQL JavaScript
 PHP
PHPMatplotlib 中 add_axes 和 add_subplot 有什麼區別?
定義
add_axes − 向圖形中新增軸。
add_subplot − 向圖形中新增軸作為子圖排列的一部分。
步驟
使用 figure()方法建立一個新圖形或啟用現有圖形。
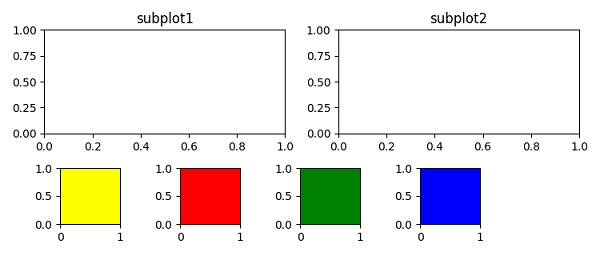
在nrows=2, ncols=2 的子圖排列中,向圖形中新增一條軸。在索引為 1 處,新增標題“subtitle1”,在索引為 2 處,新增標題“subplot2”。
建立四個矩形的點並使用 add_axes()方法向圖形中新增一條軸。
要顯示圖形,請使用show()方法。
示例
from matplotlib import pyplot as plt
plt.rcParams["figure.figsize"] = [7.50, 3.50]
plt.rcParams["figure.autolayout"] = True
fig = plt.figure()
fig.add_subplot(221)
plt.title("subplot1")
fig.add_subplot(222)
plt.title("subplot2")
rect1 = .1, .2, .1, .2
rect2 = .3, .2, .1, .2
rect3 = .5, .2, .1, .2
rect4 = .7, .2, .1, .2
fig.add_axes(rect1, facecolor="yellow")
fig.add_axes(rect2, facecolor="red")
fig.add_axes(rect3, facecolor="green")
fig.add_axes(rect4, facecolor="blue")
plt.show()
輸出

更新於: 09-Apr-2021
404 次瀏覽

廣告