
 資料結構
資料結構 網路
網路 RDBMS
RDBMS 作業系統
作業系統 Java
Java iOS
iOS HTML
HTML CSS
CSS Android
 Python
 C 程式設計
 C++
C++ C#
C# MongoDB
 MySQL
MySQL JavaScript
 PHP
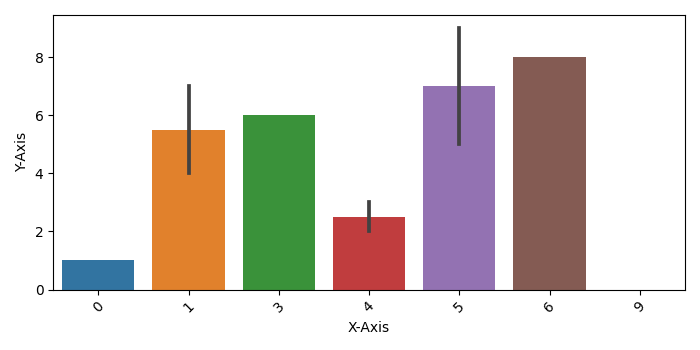
PHP使用 Seaborn 繪製 Pandas DataFrame 的多列
要使用 Seaborn 繪製 Pandas DataFrame 的多列,我們可以執行以下步驟:
使用 Pandas 製作一個數據框。
使用 Seaborn 的 barplot() 方法繪製一個條形圖。
將 xticks 標籤旋轉 45 度。
使用 show() 方法顯示圖形。
示例
import pandas
import matplotlib.pylab as plt
import seaborn as sns
import numpy as np
plt.rcParams["figure.figsize"] = [7.00, 3.50]
plt.rcParams["figure.autolayout"] = True
df = pandas.DataFrame({"X-Axis": [np.random.randint(10) for i in range(10)], "YAxis": [i for i in range(10)]})
bar_plot = sns.barplot(x='X-Axis', y='Y-Axis', data=df)
plt.xticks(rotation=45)
plt.show()
輸出

更新日期:2021 年 5 月 8 日
1K+ 瀏覽

廣告