
 資料結構
資料結構 網路
網路 關係型資料庫管理系統
 作業系統
作業系統 Java
Java iOS
iOS HTML
HTML CSS
CSS Android
 Python
 C 程式設計
 C++
C++ C#
C# MongoDB
 MySQL
MySQL Javascript
 PHP
PHP在 matplotlib 中為曲線建立邏輯陰影區域
為 matplotlib 中的曲線建立邏輯陰影區域,我們可以採取以下步驟
步驟
設定圖形大小,並調整子圖之間和子圖周圍的填充。
使用 numpy 建立 t、s1 和 s2 資料點。
建立圖形和一組子圖。
繪製 t 和 s1 資料點;沿軸線新增一條水平線。
建立一系列 xranges,建立跨越 *yrange* 的水平條形圖集合。
將 '~.Collection' 新增到軸的集合;返回 集合。
使用 Show() 方法顯示圖形。
示例
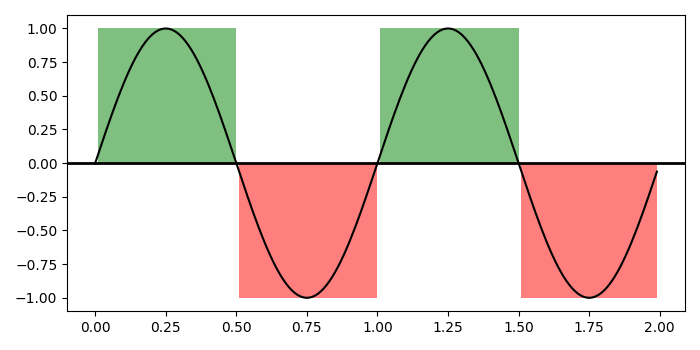
import numpy as np
import matplotlib.pyplot as plt
import matplotlib.collections as collections

plt.rcParams["figure.figsize"] = [7.00, 3.50]
plt.rcParams["figure.autolayout"] = True

t = np.arange(0.0, 2, 0.01)
s1 = np.sin(2 * np.pi * t)
s2 = 1.2 * np.sin(4 * np.pi * t)

fig, ax = plt.subplots()

ax.plot(t, s1, color='black')
ax.axhline(0, color='black', lw=2)

collection = collections.BrokenBarHCollection.span_where(t, ymin=0, ymax=1,
   where=s1 > 0, facecolor='green', alpha=0.5
)
ax.add_collection(collection)

collection = collections.BrokenBarHCollection.span_where( t, ymin=-1, ymax=0,
   where=s1 < 0, facecolor='red', alpha=0.5
)
ax.add_collection(collection)

plt.show()
輸出
將產生以下輸出 -

更新於: 19-Oct-2021
168 次瀏覽

廣告