
 資料結構
資料結構 網路
網路 關係型資料庫管理系統
 作業系統
作業系統 Java
Java iOS
iOS HTML
HTML CSS
CSS Android
 Python
 C 程式設計
 C++
C++ C#
C# MongoDB
 MySQL
MySQL Javascript
 PHP
PHP如何在 Seaborn 中檢視 axes_style 中的引數?
Seaborn 的'axes_style()' 函式允許我們透過修改各種引數來自定義繪圖的樣式。它返回一個包含控制繪圖元素外觀的引數字典,例如顏色、字型、網格線等等。要檢視這些引數,我們可以列印 'axes_style()' 返回的字典。
匯入所需庫
在開始之前,讓我們匯入必要的庫。我們需要使用以下命令匯入 Seaborn。
import seaborn as sns
檢視引數
要檢視'axes_style()' 中可用的引數,我們可以簡單地列印該函式返回的字典。
示例
當我們執行以下程式碼時,它將列印一個包含當前樣式的預設引數值的字典。
import seaborn as sns
# Print the parameters in axes_style
print(sns.axes_style())
輸出
{'axes.facecolor': 'white', 'axes.edgecolor': '.15', 'axes.grid': False, 'axes.axisbelow': True, 'axes.labelcolor': '.15', 'figure.facecolor': 'white', 'grid.color': '.8', 'grid.linestyle': '-', 'text.color': '.15', 'xtick.color': '.15', 'ytick.color': '.15', 'xtick.direction': 'out', 'ytick.direction': 'out', 'lines.solid_capstyle': , 'patch.edgecolor': 'w', 'patch.force_edgecolor': True, 'image.cmap': 'rocket', 'font.family': ['sans-serif'], 'font.sans-serif': ['Arial', 'DejaVu Sans', 'Liberation Sans', 'Bitstream Vera Sans', 'sans-serif'], 'xtick.bottom': True, 'xtick.top': False, 'ytick.left': True, 'ytick.right': False, 'axes.spines.left': True, 'axes.spines.bottom': True, 'axes.spines.right': True, 'axes.spines.top': True}
輸出字典包含定義不同繪圖元素樣式的各種引數。其中,讓我們瞭解一些常用引數。
''axes.facecolor'' − 座標軸的背景顏色。
''axes.edgecolor'' − 座標軸邊緣的顏色。
''axes.grid'' − 是否在繪圖中顯示網格線。
''axes.axisbelow'' − 網格線是否繪製在繪圖元素下方。
''axes.labelcolor'' − 座標軸標籤的顏色。
''figure.facecolor'' − 圖形的背景顏色。
這些只是一些示例,還有許多其他引數可用於控制繪圖外觀的不同方面。
應用樣式並檢視引數
要檢視特定樣式的引數,我們可以使用 'sns.set_style()' 應用該樣式,然後列印 'sns.axes_style()' 返回的字典。
透過使用 'sns.set_style()' 應用特定樣式,我們可以檢視該樣式特有的引數。例如,如果我們將樣式設定為 ''darkgrid'',則列印的字典將包含 'darkgrid' 樣式的引數。
示例
import seaborn as sns

# Apply a style
sns.set_style('darkgrid')
# Print the parameters in axes_style for the applied style
print(sns.axes_style())
輸出
{'axes.facecolor': '#EAEAF2', 'axes.edgecolor': 'white', 'axes.grid': True, 'axes.axisbelow': True, 'axes.labelcolor': '.15', 'figure.facecolor': 'white', 'grid.color': 'white', 'grid.linestyle': '-', 'text.color': '.15', 'xtick.color': '.15', 'ytick.color': '.15', 'xtick.direction': 'out', 'ytick.direction': 'out', 'lines.solid_capstyle': , 'patch.edgecolor': 'w', 'patch.force_edgecolor': True, 'image.cmap': 'rocket', 'font.family': ['sans-serif'], 'font.sans-serif': ['Arial', 'DejaVu Sans', 'Liberation Sans', 'Bitstream Vera Sans', 'sans-serif'], 'xtick.bottom': False, 'xtick.top': False, 'ytick.left': False, 'ytick.right': False, 'axes.spines.left': True, 'axes.spines.bottom': True, 'axes.spines.right': True, 'axes.spines.top': True}
使用引數自定義繪圖樣式
檢視可用引數後,我們可以使用它們來自定義繪圖樣式。要修改特定引數,我們可以將其作為引數傳遞給 'sns.set_style()'。
示例
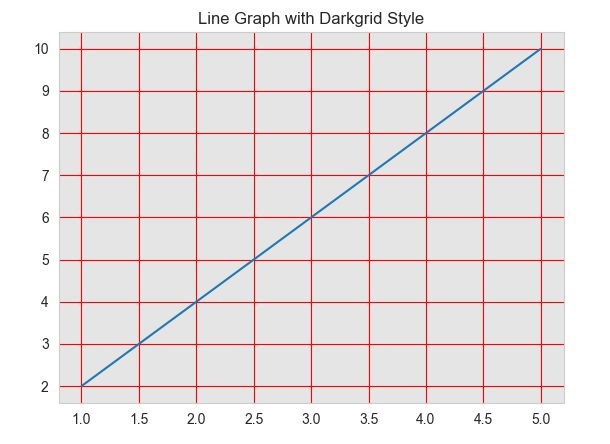
在此示例中,我們透過將引數字典作為第二個引數傳遞給 'sns.set_style()' 來自定義繪圖樣式。我們將 ''axes.facecolor'' 引數設定為淺灰色,''grid.color'' 引數設定為紅色,''axes.labelcolor'' 引數設定為藍色。
import seaborn as sns
import matplotlib.pyplot as plt

# Generate some random data for plotting
x = [1, 2, 3, 4, 5]
y = [2, 4, 6, 8, 10]


# Set the style to "darkgrid"
sns.set_style("darkgrid")

# Customize the plot style using parameters
sns.set_style(
   'whitegrid',
   {'axes.facecolor': '#E5E5E5', 'grid.color': 'red', 'axes.labelcolor': 'blue'}
)

# Plot a line graph using the darkgrid style
plt.plot(x, y)
plt.title("Line Graph with Darkgrid Style")
plt.show()
輸出

107 次瀏覽
