
 資料結構
資料結構 網路
網路 RDBMS
RDBMS 作業系統
作業系統 Java
Java iOS
iOS HTML
HTML CSS
CSS Android
 Python
 C 程式設計
 C++
C++ C#
C# MongoDB
 MySQL
MySQL Javascript
 PHP
PHP如何在地圖(Matplotlib)中使用自定義 png 圖片標記?
要將自定義的 png 或 jpg,即影像用作圖中的標記,我們可以採取以下步驟 −
設定影像大小並調整子圖之間的和周圍的填充。
建立一個路徑列表以儲存影像的目錄。
建立一個點列表 (x 和 y)。
使用 subplots() 方法,建立一個影像和一組子圖。
為了繪製圖像而不是點,迭代 x、y 和路徑。
用影像和 (x,y) 點例項化 AnnotationBbox()。
在兩個軸上放置 xticks 和 yticks。
要顯示影像,請使用 show() 方法。
示例
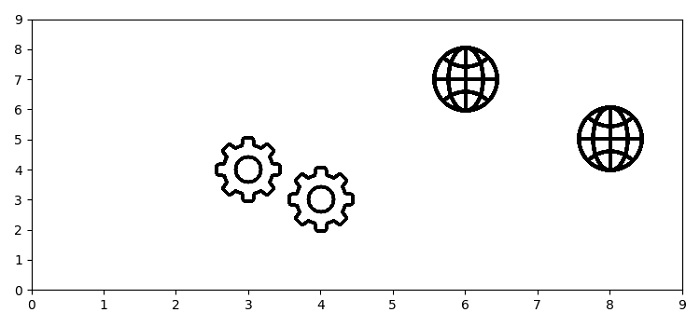
import matplotlib.pyplot as plt
from matplotlib.offsetbox import OffsetImage, AnnotationBbox

plt.rcParams["figure.figsize"] = [7.50, 3.50]
plt.rcParams["figure.autolayout"] = True

def getImage(path):
   return OffsetImage(plt.imread(path, format="jpg"), zoom=.1)

paths = ['globe.jpg', 'settings.jpg', 'settings.jpg', 'globe.jpg']
x = [8, 4, 3, 6]
y = [5, 3, 4, 7]
fig, ax = plt.subplots()
for x0, y0, path in zip(x, y, paths):
   ab = AnnotationBbox(getImage(path), (x0, y0), frameon=False)
   ax.add_artist(ab)
plt.xticks(range(10))
plt.yticks(range(10))
plt.show()
輸出

更新於: 2021 年 6 月 3 日
4K+ 次觀看

廣告