
 資料結構
資料結構 網路
網路 RDBMS
RDBMS 作業系統
作業系統 Java
Java iOS
iOS HTML
HTML CSS
CSS Android
 Python
 C程式設計
C程式設計 C++
C++ C#
C# MongoDB
 MySQL
MySQL Javascript
 PHP
PHP如何使用Matplotlib繪製兩條虛線和設定標記?
在本程式中,我們將使用matplot庫繪製兩條線。在開始編寫程式碼之前,我們需要首先使用以下命令匯入matplotlib庫 -
Import matplotlib.pyplot as plt
Pyplot是一個命令樣式函式集合,使matplotlib像MATLAB一樣工作。
演算法
Step 1: Import matplotlib.pyplot
Step 2: Define line1 and line2 points.
Step 3: Plot the lines using the plot() function in pyplot.
Step 4: Define the title, X-axis, Y-axis.
Step 5: Display the plots using the show() function.
示例程式碼
import matplotlib.pyplot as plt

line1_x = [10,20,30]
line1_y = [20,40,10]

line2_x = [10,20,30]
line2_y= [40,10,30]

plt.xlabel('X AXIS')
plt.ylabel('Y AXIS')

plt.plot(line1_x ,line1_y , color='blue', linewidth = 3, label = 'line1-dotted',linestyle='dotted')
plt.plot(line2_x ,line2_y, color='red', linewidth = 5, label = 'line2-dashed', linestyle='dotted')

plt.title("PLOTTING DOTTED LINES")
plt.legend()

plt.show()
輸出
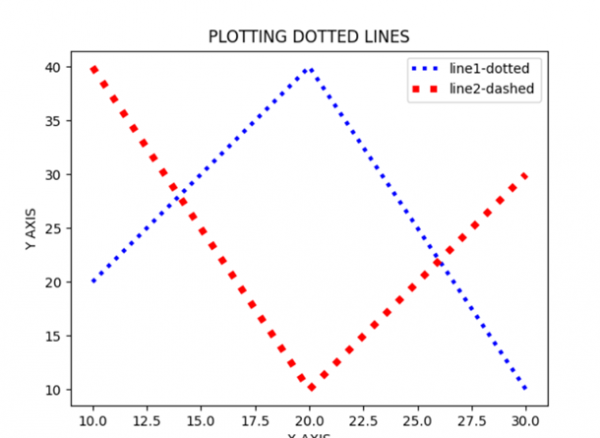
解釋
變數line1_x、line_y和line2_x、line2_y是我們線上的座標。繪圖函式中的linewidth引數基本上是我們正在繪製的線框的寬度/粗細度。程式中的plt.legend()函式用於在圖表上放置圖例,如x軸、y軸名稱。

更新日期:2021-3-16
2K+ 瀏覽量

廣告