
 資料結構
資料結構 網路
網路 RDBMS
RDBMS 作業系統
作業系統 Java
Java iOS
iOS HTML
HTML CSS
CSS Android
 Python
 C 程式設計
 C++
C++ C#
C# MongoDB
 MySQL
MySQL Javascript
 PHP
PHP如何設定 matplotlib 中軸乘數的值?
若要設定 matplotlib 中軸乘數的值,我們可以採取以下步驟 -
步驟
設定圖形大小並且調整子圖之間的填充以及周圍的填充。
使用 numpy 建立 x 資料點。
使用 plot() 方法繪製 x 和 x2。
獲取圖形的當前軸。
初始化一個變數 multiplier,即軸乘數的值。
在視區間隔中將每個整數倍數設定為一個刻度。
設定主刻度的定位器。
若要顯示圖形,使用 show() 方法。
示例
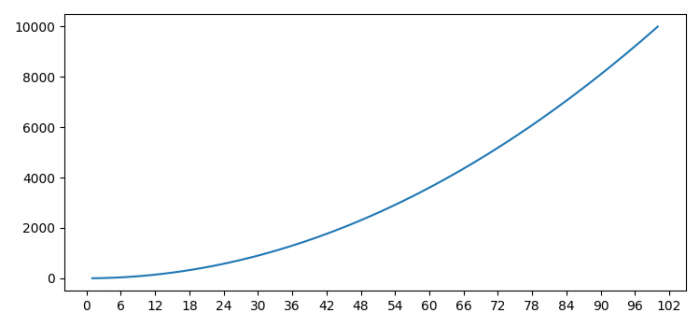
# Import matplotlib and numpy
from matplotlib import pyplot as plt
import numpy as np

# Set the figure size
plt.rcParams["figure.figsize"] = [7.50, 3.50]
plt.rcParams["figure.autolayout"] = True

# Create x data points
x = np.linspace(1, 100, 100)

# Plot x and x2
plt.plot(x, x**2)

# Get the current axis
ax = plt.gca()

# Axis multiplier
multiplier = 6

# Set a tick on each integer multiple
locator = plt.MultipleLocator(multiplier)

# Set the locator of the major ticker
ax.xaxis.set_major_locator(locator)

plt.show()
輸出
它會產生以下輸出 -

更新於: 01-Feb-2022
2 千次瀏覽

廣告