
 資料結構
資料結構 網路
網路 RDBMS
RDBMS 作業系統
作業系統 Java
Java iOS
iOS HTML
HTML CSS
CSS Android
 Python
 C 程式設計
 C++
C++ C#
C# MongoDB
 MySQL
MySQL Javascript
 PHP
PHP如何在 R 中使用 ggplot2 將圖例設定在右上角?
使用 ggplot2 建立的繪圖中的預設圖例位置為右側,但我們可以透過使用具有 legend.position 引數和 legend.justification 引數的主題函式來更改位置。要將圖例設定在右上角,我們可以使用 legend.position="top" 和 legend.justification="right"。
示例
考慮下面的資料幀
考慮下面的資料幀
> x<-c("Mango","Guava","Pomegranate")
> freq<-c(212,220,218)
> df<-data.frame(x,freq)
> df
輸出
x freq
1 Mango 212
2 Guava 220
3 Pomegranate 218
載入 ggplot2 包並使用圖例建立條形圖
> library(ggplot2)
> ggplot(df,aes(x,freq,fill=x))+geom_bar(stat="identity")
輸出

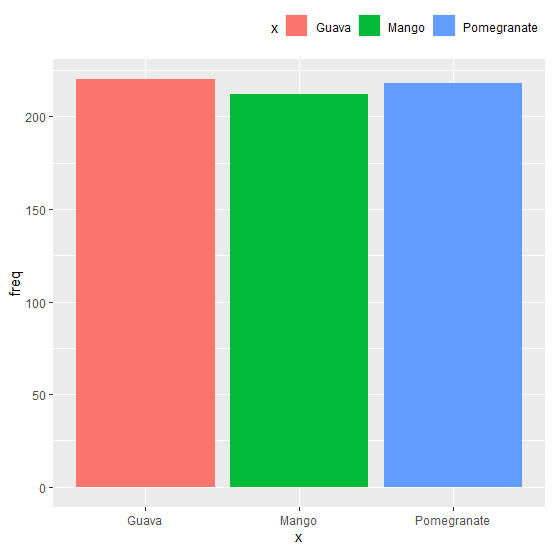
在圖表右上角建立帶圖例的條形圖
示例
> ggplot(df,aes(x,freq,fill=x))+geom_bar(stat="identity")+theme(legend.position="top",legend.justification="right")
輸出

更新日期:07-11-2020
3K+ 瀏覽量

廣告