
 資料結構
資料結構 網路
網路 RDBMS
RDBMS 作業系統
作業系統 Java
Java iOS
iOS HTML
HTML CSS
CSS Android
 Python
 C 語言
C 語言 C++
C++ C#
C# MongoDB
 MySQL
MySQL Javascript
 PHP
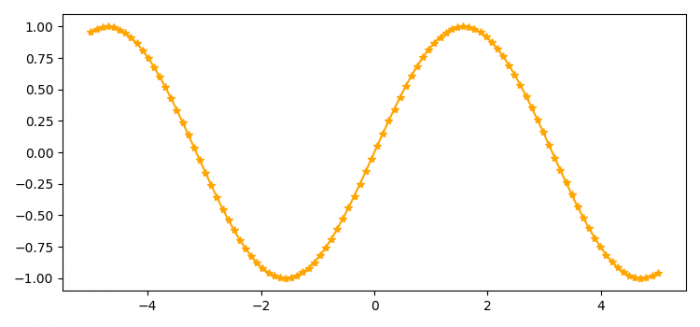
PHP如何在 Matplotlib 中設定線顏色為橙色,並指定線條標記?
要在 Matplotlib 中將線條顏色設定為橙色並指定線條標記,我們可以採取以下步驟 −
步驟
設定圖形大小並調整子圖之間和周圍的邊距。
使用 numpy 建立x和y資料點。
使用屬性color='orange'和marker='*'繪製x和y資料點。
要顯示圖形,請使用show()方法。
示例
import matplotlib.pyplot as plt
import numpy as np

# Set the figure size
plt.rcParams["figure.figsize"] = [7.50, 3.50]
plt.rcParams["figure.autolayout"] = True

# x and y data points
x = np.linspace(-5, 5, 100)
y = np.sin(x)

# Plot the data points with color and marker attributes
plt.plot(x, y, color='orange', marker="*")

# Display the plot
plt.show()
輸出
將產生以下輸出 −

更新於: 01-02-2022
3K+ 瀏覽次數

廣告