
 資料結構
資料結構 網路
網路 RDBMS
RDBMS 作業系統
作業系統 Java
Java iOS
iOS HTML
HTML CSS
CSS Android
 Python
 C 程式設計
 C++
C++ C#
C# MongoDB
 MySQL
MySQL JavaScript
 PHP
PHP如何在 Matplotlib 中使用 path_effect 屬性在繪圖中提供陰影效果
為了在繪圖或圖表中提供陰影效果等路徑效果,我們可以使用 path_effect 屬性。
例如,讓我們看看如何在 Matplotlib 中使用 path_effect 屬性為 sigmoid 函式新增陰影效果。
import matplotlib.pyplot as plt
import numpy as np
from matplotlib.patheffects import PathPatchEffect, SimpleLineShadow, Normal
現在,讓我們定義圖形的大小並繪製 sigmoid 函式:
plt.style.use('seaborn-deep')
plt.subplots(figsize=(10,10))
讓我們定義繪圖的資料點:
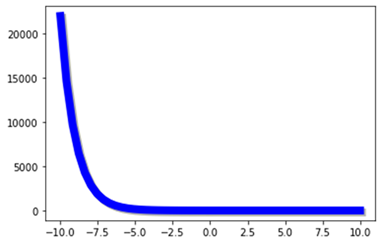
x = np.linspace(-10, 10, 50)
y = 1+ np.exp(-x))
讓我們定義繪圖中的陰影屬性:
plt.plot(x, y, linewidth=8, color='blue', path_effects=
[SimpleLineShadow(), Normal()])
#Show the Plot
plt.show()
輸出

更新於: 23-Feb-2021
1K+ 檢視

廣告