
 資料結構
資料結構 網路
網路 關係資料庫管理系統 (RDBMS)
 作業系統
作業系統 Java
Java iOS
iOS HTML
HTML CSS
CSS Android
 Python
 C語言程式設計
 C++
C++ C#
C# MongoDB
 MySQL
MySQL Javascript
 PHP
PHP如何在MATLAB中歸一化直方圖?
直方圖不過是一種圖形表示,它顯示了一組資料點的分佈。直方圖的歸一化是一個將它的頻率分佈在一個較寬範圍內的方法。
在討論MATLAB中直方圖歸一化的實現之前,讓我們首先概述一下直方圖歸一化。
什麼是直方圖歸一化?
直方圖是一種圖形化地表示資料集頻率分佈的方法。有時,我們會看到一個直方圖,其中頻率分佈在一個很小的範圍內。這會導致數字影像對比度變差。
有一種叫做“直方圖歸一化”的技術,用於將資料集的頻率分佈在更寬的範圍內。
在數字影像處理中,直方圖歸一化用於提高影像的對比度。
數學上,直方圖歸一化使用以下公式執行:
$$\mathrm{直方圖歸一化=\frac{(強度 − 最小值)}{(最大值 − 最小值)}× 255}$$
現在,讓我們討論MATLAB中直方圖歸一化的過程。
MATLAB中的直方圖歸一化
在MATLAB中,直方圖的歸一化按照以下步驟執行:
步驟(1) - 讀取需要歸一化直方圖的數字影像。為此,使用“imread”函式。
步驟(2) - 根據需要將輸入影像轉換為灰度影像。為此,使用“rgb2gray”函式。
步驟(3) - 將灰度影像轉換為雙精度資料型別以進行計算。為此,使用“double”函式。
步驟(4) - 指定直方圖歸一化所需的最小值和最大值。
步驟(5) - 使用直方圖歸一化公式進行直方圖歸一化。
步驟(6) - 顯示結果。
示例
讓我們透過一個示例來了解執行這些步驟以對影像進行直方圖歸一化的實現和執行。
% MATLAB code to perform histogram normalization
% Read the input image
img = imread('https://tutorialspoint.tw/assets/questions/media/14304-1687425269.jpg');

% Convert the input image to grayscale
gray_img = rgb2gray(img);

% Convert the grayscale image to double datatype
double_img = double(gray_img);

% Specify the minimum and maximum values for histogram normalization
min_value = 50;
max_value = 170;

% Perform histogram normalization
norm_img = (double_img - min_value) / (max_value - min_value);

% Scale the normalized image
scaled_img = norm_img * 255;

% Convert the scaled image to uint8 to display
hist_norm_img = uint8(scaled_img);

% Display the input image, normalized image, and their histograms
figure;
subplot(2, 2, 1);
imshow(gray_img);
title('Input Image');

subplot(2, 2, 2);
imhist(gray_img);
title('Input Image Histogram');

subplot(2, 2, 3);
imshow(hist_norm_img);
title('Normalized Image');

subplot(2, 2, 4);
imhist(hist_norm_img);
title('Normalized Histogram');
輸出
執行此程式碼時,將產生以下輸出:
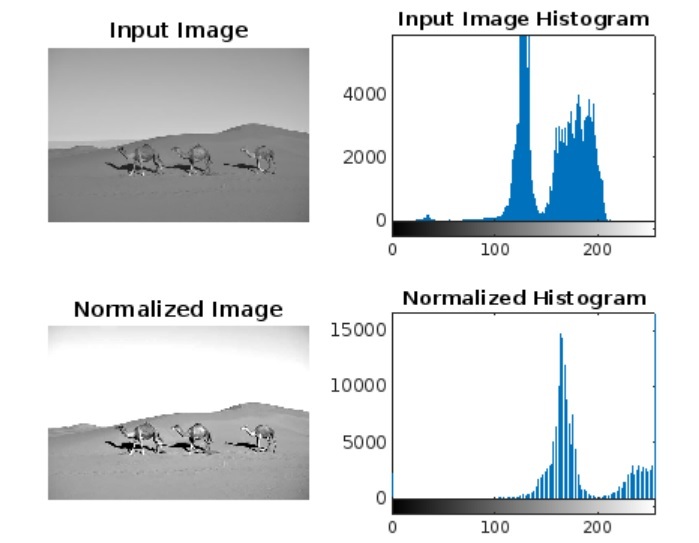
結論
總之,直方圖歸一化是一種將資料集的頻率分佈在更寬的範圍內以提高對比度的方法。在本教程中,我透過MATLAB中的示例解釋了影像直方圖歸一化的分步過程。

更新於:2023年10月6日
462 次瀏覽

廣告