
 資料結構
資料結構 網路
網路 RDBMS
RDBMS 作業系統
作業系統 Java
Java iOS
iOS HTML
HTML CSS
CSS Android
 Python
 C 程式設計
 C++
C++ C#
C# MongoDB
 MySQL
MySQL Javascript
 PHP
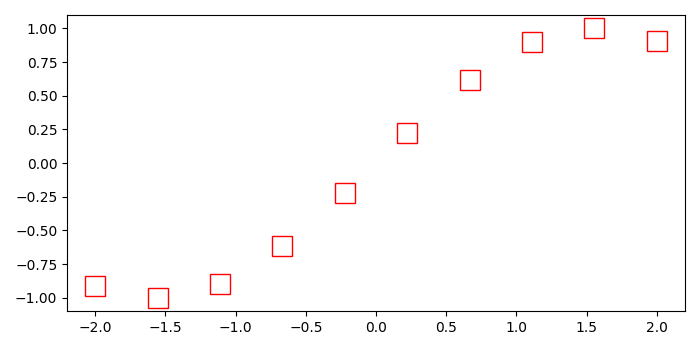
PHP如何使用 Python 中的 Matplotlib 製作空心方塊標記?
要使用 Matplotlib 製作空心方塊標記,我們可以使用標記“ks”、“markerfacecolor='none'”、“markersize=15”和“markeredgecolor=red”。
步驟
使用 numpy 建立 x 和 y 資料點。
建立圖形或啟用現有圖形,將軸新增到圖形作為子圖排列的一部分。
使用 plot() 方法繪製 x 和 y 資料點。要製作空心方塊標記,我們可以使用標記“ks”、“markerfacecolor="none"”、“markersize="15"”和“markeredge color="red"”。
要顯示圖形,請使用 show() 方法。
示例
import numpy as np
from matplotlib import pyplot as plt
plt.rcParams["figure.figsize"] = [7.00, 3.50]
plt.rcParams["figure.autolayout"] = True
x = np.linspace(-2, 2, 10)
y = np.sin(x)
fig = plt.figure()
ax1 = fig.add_subplot(111)
ax1.plot(x, y, 'ks', markerfacecolor='none', ms=15, markeredgecolor='red')
plt.show()
輸出

更新於: 2021 年 5 月 11 日
5K+ 次瀏覽

廣告