
 資料結構
資料結構 網路
網路 RDBMS
RDBMS 作業系統
作業系統 Java
Java iOS
iOS HTML
HTML CSS
CSS Android
 Python
 C 程式設計
 C++
C++ C#
C# MongoDB
 MySQL
MySQL Javascript
 PHP
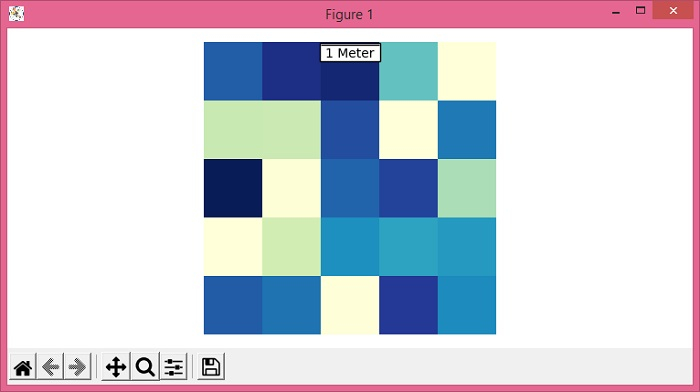
PHP如何在 Matplotlib 中的地圖中插入比例尺?
要在 matplotlib 中的地圖中插入比例尺,我們可以使用 AnchoredBar() 類例項化比例尺物件。
步驟
設定影像大小並調整子圖之間的間距和周圍的間距。
使用 numpy 建立隨機資料。
使用 imshow() 方法將資料顯示為影像,即,在 2D 規則光柵上。
使用 gca() 方法獲取當前座標系。
繪製一條水平比例尺,在下方帶有居中對齊的標籤。
向當前座標系新增一條比例尺 artist。
關閉座標系。
要顯示影像,請使用 show() 方法。
示例
from matplotlib import pyplot as plt
from mpl_toolkits.axes_grid1.anchored_artists import AnchoredSizeBar
import numpy as np

plt.rcParams["figure.figsize"] = [7.50, 3.50]
plt.rcParams["figure.autolayout"] = True

data = np.random.rand(5, 5)

img = plt.imshow(data, cmap="YlGnBu")
ax = plt.gca()
scalebar = AnchoredSizeBar(ax.transData, 1, "1 Meter", 9)

ax.add_artist(scalebar)
ax.axis('off')
plt.show()
輸出

更新於: 2021-06-03
2K+ 瀏覽

廣告