
 Data Structure
 Networking
 RDBMS
RDBMS Operating System
 Java
Java iOS
iOS HTML
HTML CSS
CSS Android
 Python
 C Programming
 C++
C++ C#
C# MongoDB
 MySQL
MySQL Javascript
 PHP
PHP如何在 Python(使用 Matplotlib)中讓函式返回一個圖形?
要在 Python 中讓函式返回一個圖形(使用 Matplotlib),我們可以採取以下步驟 −
設定圖形尺寸並調整子圖之間以及周圍的填充。
使用 numpy 建立 x 和 y 資料點。
建立一個函式 plot(x, y),使用 figure() 方法建立一個新圖形或啟用一個現有圖形。
使用 plot() 方法繪製 x 和 y 資料點;返回 fig 例項。
呼叫 plot(x, y) 方法並將圖形例項儲存在 f 變數中。
要顯示圖形,請使用 show() 方法。
示例
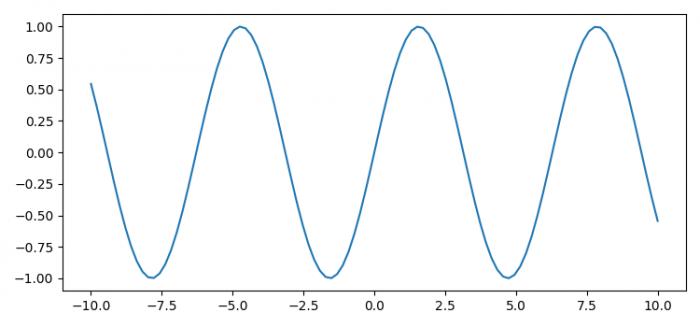
import numpy as np
from matplotlib import pyplot as plt

plt.rcParams["figure.figsize"] = [7.50, 3.50]
plt.rcParams["figure.autolayout"] = True

def plot(x, y):
   fig = plt.figure()
   plt.plot(x, y)
   return fig

x = np.linspace(-10, 10, 100)
y = np.sin(x)

f = plot(x, y)

plt.show()
輸出

更新時間:2021-09-23
15K+ 瀏覽量

廣告