
 資料結構
資料結構 網路技術
網路技術 RDBMS
RDBMS 作業系統
作業系統 Java
Java iOS
iOS HTML
HTML CSS
CSS Android
 Python
 C 程式設計
 C++
C++ C#
C# MongoDB
 MySQL
MySQL Javascript
 PHP
PHP如何在 R 中使用 ggplot2 在 Y 軸中顯示歐元符號?
如果 R 資料幀中有一列歐元貨幣作為響應變數,我們可能需要在使用 ggplot2 包建立的繪圖中顯示歐元符號。為此,我們可以使用 scales 包,並透過使用命令 scale_y_continuous(labels=dollar_format(suffix="€",prefix="")) 來將 Y 軸刻度更改為繪圖命令。
考慮一下以下資料幀 -
示例
x<-rpois(20,5)
y<-rpois(20,100)
df<-data.frame(x,y)
df
輸出
   x   y
1  8   112
2  10  81
3  4   97
4  7   104
5  4   98
6  5   99
7  5   97
8  7   97
9  5   95
10 3   98
11 6   92
12 6   80
13 6   92
14 6  108
15 7  113
16 4  103
17 3  106
18 2  116
19 4  105
20 6  83
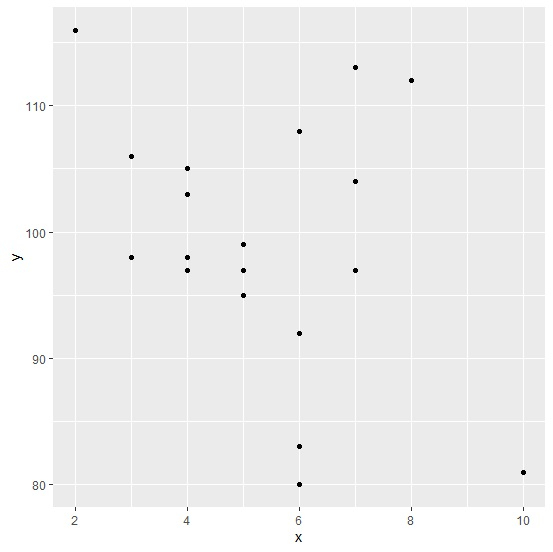
載入 ggplot2 包並建立 x 和 y 之間的散點圖 -
示例
library(ggplot2)
ggplot(df,aes(x,y))+geom_point()
輸出
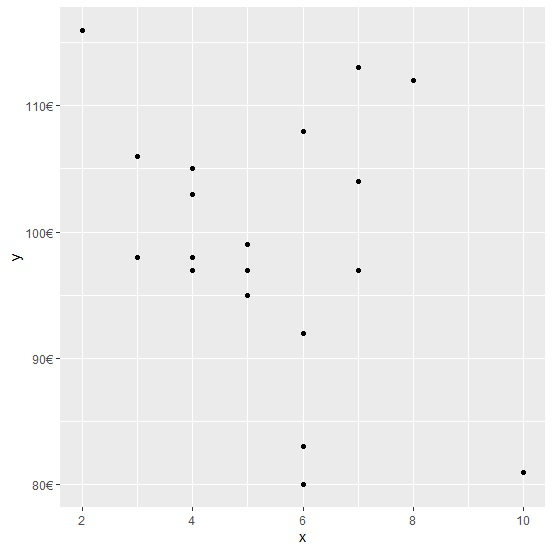
載入 scales 包並建立顯示歐元符號的 Y 軸標籤散點圖 -
示例
library(scales)
ggplot(df)+geom_point(aes(x,y))+scale_y_continuous(labels=dollar_format(suffix="€",prefix=""))
輸出

更新時間: 2021 年 2 月 10 日
910 次瀏覽

廣告