
 資料結構
資料結構 網路
網路 關係資料庫管理系統
 作業系統
作業系統 Java
Java iOS
iOS HTML
HTML CSS
CSS Android
 Python
 C 程式設計
 C++
C++ C#
C# MongoDB
 MySQL
MySQL Javascript
 PHP
PHP如何在 Android 的 GraphView 中建立自定義資料點形狀?
Android 中 GraphView 的自定義形狀指的是能夠為圖表中的資料點建立和使用個性化形狀的能力。預設情況下,圖表庫提供基本的形狀,例如圓形或正方形來表示資料點。但是,自定義形狀允許開發者自定義和使用他們自己的獨特形狀,例如三角形、星形或任何其他所需的圖案。這種自定義增強了資料點的視覺吸引力和獨特性,使圖表更具視覺吸引力和資訊性。開發者可以透過自定義形狀的屬性或使用影像資源來建立自定義形狀。然後,他們可以將這些形狀分配給特定的資料點,從而提供個性化且視覺上吸引人的圖表體驗。
使用的方法
手動實現
手動實現
在 Android 的 GraphView 中建立自定義資料點形狀的上下文中,手動實現指的是使用程式設計方法手動定義和建立形狀的過程。與依賴於庫提供的預定義形狀不同,開發者可以透過指定形狀的座標、頂點和路徑來建立自己的自定義形狀。這允許完全控制形狀的外觀和設計。手動實現涉及編寫程式碼以定義形狀的屬性,例如大小、顏色和筆觸。它提供了靈活性和自定義選項,可以根據特定需求和設計偏好調整資料點的形狀,從而帶來更加個性化和視覺上吸引人的圖表體驗。
演算法
啟動應用程式。
初始化圖表和資料點所需的變數和資料結構。
在使用者介面中設定 GraphView 元件以顯示圖表。
建立一個自定義 Shape 類來定義資料點形狀的屬性和外觀。
在 Shape 類中實現必要的方法,例如 draw(),以處理自定義形狀的渲染。
建立一個數組列表或其他合適的資料結構來儲存資料點。
使用值填充資料點,並將每個點與一個自定義形狀物件相關聯。
在 GraphView 元件中,遍歷資料點,並使用其對應的自定義形狀繪製每個點。
實現功能以處理使用者與資料點的互動,例如點選事件或工具提示。
測試應用程式以確保自定義形狀正確顯示並可互動。
最佳化程式碼以提高執行效率和記憶體使用率,考慮諸如高效繪圖程式或快取等因素。
以靈活的方式處理任何潛在的錯誤或異常,以確保流暢的使用者體驗。
完成應用程式,進行徹底的測試,並根據使用者反饋或錯誤報告進行任何必要的修改。
程式
新增依賴項
依賴項 `com.rati:graphview:4.2.2` 包含在 Gradle 構建檔案中,以在 Android 專案中包含 GraphView 庫。此庫提供建立和顯示圖表的功能,用於 Android 應用程式。
透過包含此依賴項,開發者可以訪問 GraphView 庫,從而簡化圖表建立、自定義和互動的過程。它提供了各種圖表型別,例如折線圖、柱狀圖和散點圖,以及縮放、滾動和資料點突出顯示等功能。依賴項中指定的版本(`4.2.2`)確保與該版本中包含的特定功能和錯誤修復相容。定期檢查庫的更新以利用最新的改進和更改非常重要。
XML 程式
<?xml version="1.0" encoding="utf-8"?>
<RelativeLayout
   xmlns:android="http://schemas.android.com/apk/res/android"
   xmlns:tools="http://schemas.android.com/tools"
   android:layout_width="match_parent"
   android:layout_height="match_parent"
   tools:context=".MainActivity">

   <com.jjoe64.graphview.GraphView
      android:id="@+id/graphview"
	  android:layout_width="match_parent"
	  android:layout_height="match_parent" />

</RelativeLayout>
Java 程式
import android.graphics.Canvas;
import android.graphics.Color;
import android.graphics.Paint;
import android.os.Bundle;

import androidx.appcompat.app.AppCompatActivity;

import com.rati.graphview.GraphView;
import com.rati.graphview.series.DataPoint;
import com.rati.graphview.series.DataPointInterface;
import com.rati.graphview.series.PointsGraphSeries;

public class MainActivity extends AppCompatActivity {

   GraphView graphView;

   @Override
   protected void onCreate(Bundle savedInstanceState) {
      super.onCreate(savedInstanceState);
      setContentView(R.layout.activity_main);
      graphView = findViewById(R.id.graphview);

      // Create PointGraphSeries with custom shape
      PointsGraphSeries<DataPoint> series = new PointsGraphSeries<>(getDataPoint());

      graphView.addSeries(series);

      // Set properties for the series
      series.setSize(50);
      series.setColor(Color.RED);

      // Define the custom shape for data points
      series.setCustomShape(new PointsGraphSeries.CustomShape() {
         @Override
         public void draw(Canvas canvas, Paint paint, float x, float y, DataPointInterface dataPoint) {
            paint.setStrokeWidth(5);
            // Draw a custom shape using lines
            canvas.drawLine(x - 20, y, x, y - 20, paint);
            canvas.drawLine(x, y - 20, x + 20, y, paint);
            canvas.drawLine(x + 20, y, x, y + 20, paint);
            canvas.drawLine(x - 20, y, x, y + 20, paint);
         }
      });
   }

   // Initialize the data points
   private DataPoint[] getDataPoint() {
      DataPoint[] dp = new DataPoint[]{
         new DataPoint(0, 1),
         new DataPoint(2, 1),
         new DataPoint(3, 5),
         new DataPoint(6, 2),
         new DataPoint(7, 8),
      };
      return dp;
   }
}
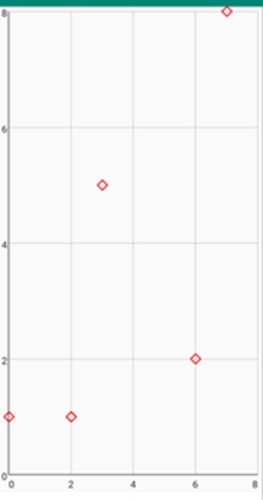
輸出
結論
本文闡明瞭如何在 Android 的 GraphView 中為資料點建立自定義形狀。它涵蓋了自定義形狀的概念及其在增強圖表視覺吸引力和獨特性方面的意義。文章討論了手動實現方法,其中包括以程式設計方式定義和建立形狀。它提供了建立自定義形狀所涉及步驟的演算法圖,以及一個示例程式碼片段。
文章最後強調了全面測試、最佳化和錯誤處理的重要性,以確保流暢的使用者體驗。總而言之,它指導開發者使用 GraphView 中的自定義形狀建立個性化且視覺上吸引人的圖表。

127 次瀏覽
