
 資料結構
資料結構 網路
網路 RDBMS
RDBMS 作業系統
作業系統 Java
Java iOS
iOS HTML
HTML CSS
CSS Android
 Python
 C 程式設計
 C++
C++ C#
C# MongoDB
 MySQL
MySQL Javascript
 PHP
PHP如何檢查基本 R 中繪圖生成時間之間的差異?
R 中一個最常用的時間度量函式是 microbenchmark 包的 microbenchmark 函式。我們可以將函式傳遞到 microbenchmark 函式內部以建立繪圖,這將產生每個繪圖的處理時間,然後可以對差異進行比較。
示例 1
載入 microbenchmark 包
> library(microbenchmark)
查詢繪圖生成時間
> x1<-rpois(10,5)
> x2<-rpois(100,5)
> x3<-rpois(1000,5)
> X<-microbenchmark(plot(x1),plot(x2),plot(x3))
> X
單位:毫秒
   expr      min    lq       mean     median uq       max  neval
plot(x1) 12.7488 14.88815 15.65040 15.2515 15.90765 23.9348  100
plot(x2) 20.9810 21.67780 23.92976 22.2116 23.29665 137.2474 100
plot(x3) 93.6965 95.03440 96.67086 95.6717 97.12290 125.3670 100
繪圖
示例
> plot(x1)
輸出

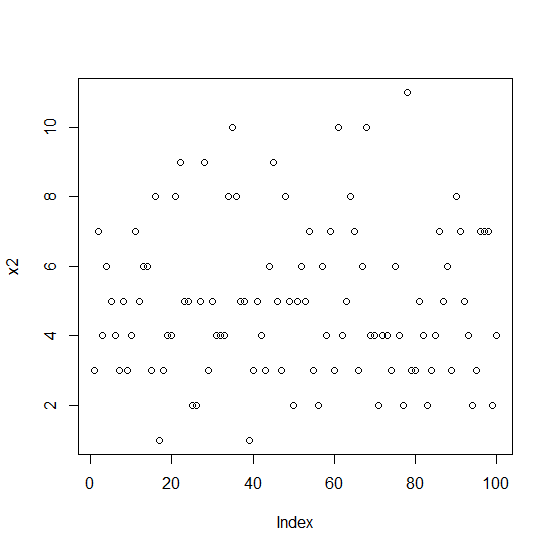
示例
> plot(x2)
輸出
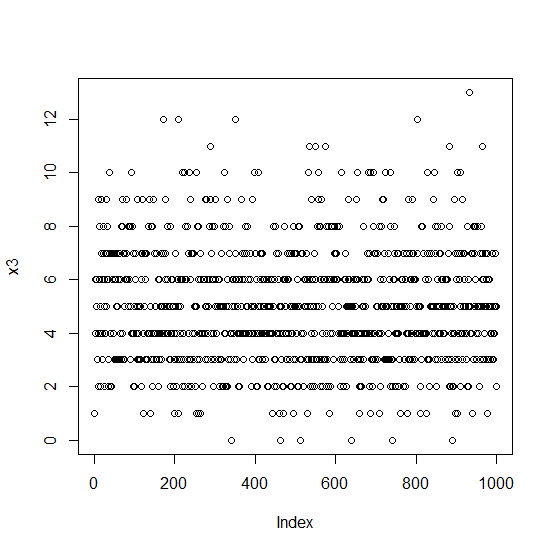
示例
> plot(x3)
輸出

更新於: 06-11-2020
61 次瀏覽

廣告