
 資料結構
資料結構 網路
網路 RDBMS
RDBMS 作業系統
作業系統 Java
Java iOS
iOS HTML
HTML CSS
CSS Android
 Python
 C 程式設計
 C++
C++ C#
C# MongoDB
 MySQL
MySQL Javascript
 PHP
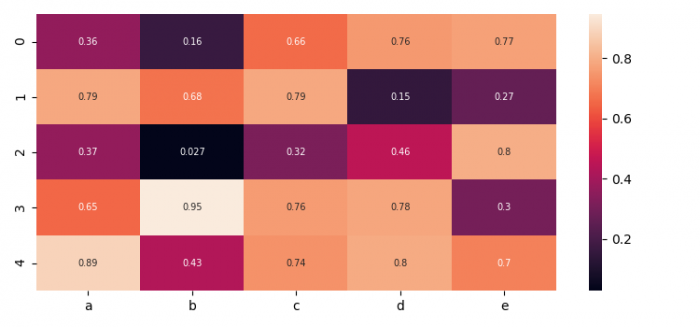
PHP如何註釋 Seaborn 中熱圖的每個單元格?
為了註釋熱圖的每個單元格,我們可以在 heatmap() 方法中設定 annot = True。
步驟
- 設定圖形大小並在子圖之間和周圍調整內邊距。
- 使用 5 列建立一個 Pandas 資料框。
- 使用 sns.heatmap() 在引數中使用 annot=True 標誌繪製帶有 步驟 2 的資料框。
- 為了顯示圖片,使用 show() 方法。
示例
import seaborn as sns
import pandas as pd
import numpy as np
import matplotlib.pyplot as plt
plt.rcParams["figure.figsize"] = [7.50, 3.50]
plt.rcParams["figure.autolayout"] = True
df = pd.DataFrame(np.random.random((5, 5)), columns=["a", "b", "c", "d", "e"])
sns.heatmap(df, annot=True, annot_kws={"size": 7})
plt.show()
輸出

更新時間: 02-06-2021
1 千 + 次瀏覽

廣告