
 資料結構
資料結構 聯網
聯網 RDBMS
RDBMS 作業系統
作業系統 Java
Java iOS
iOS HTML
HTML CSS
CSS Android
 Python
 C 程式設計
 C++
C++ C#
C# MongoDB
 MySQL
MySQL Javascript
 PHP
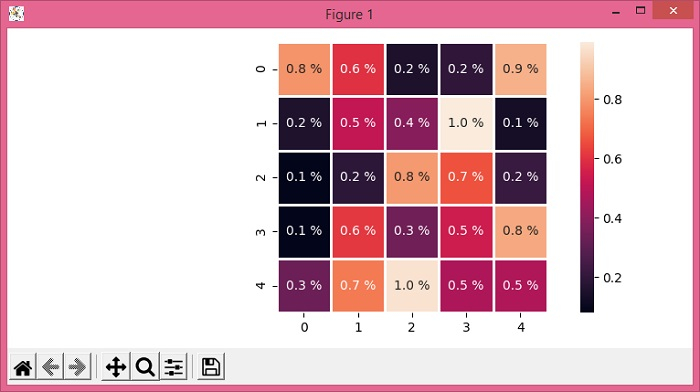
PHP在 Seaborn 中為熱圖批註新增單位
要向 Seaborn 中的熱圖批註新增單位,我們可以採取以下步驟 -
設定圖表大小並調整子圖之間和周圍的邊距。
使用 numpy 建立一個 5×5 維度矩陣。
以顏色編碼矩陣的形式繪製矩形資料。
用 %age 單位註釋熱圖值。
要顯示圖表,使用 show() 方法。
示例
import matplotlib.pyplot as plt
import seaborn as sns
import numpy as np

plt.rcParams["figure.figsize"] = [7.50, 3.50]
plt.rcParams["figure.autolayout"] = True

data = np.random.rand(5, 5)

ax = sns.heatmap(data, annot=True, fmt='.1f', square=1, linewidth=1.)

for t in ax.texts: t.set_text(t.get_text() + " %")

plt.show()
輸出

更新於: 04-6 月 -2021
537 次瀏覽

廣告