
 資料結構
資料結構 網路
網路 RDBMS
RDBMS 作業系統
作業系統 Java
Java iOS
iOS HTML
HTML CSS
CSS Android
 Python
 C 程式設計
 C++
C++ C#
C# MongoDB
 MySQL
MySQL Javascript
 PHP
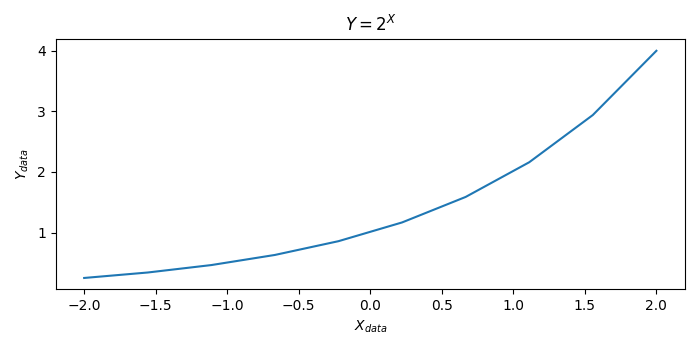
PHP如何在 Matplotlib 中製作無襯線字型上標或下標文字?
要在 matplotlib 中製作上標或下標文字,請使用 LaTeX 表示形式。
步驟
使用 numpy 建立 x 和 y 資料點。
使用 plot() 方法繪製 x 和 y 資料點。
使用 title() 方法,用 LateX 表示形式放上標題。
使用 xlabel 和 ylabel 方法來設定軸的標籤。
示例
import numpy as np
from matplotlib import pyplot as plt
plt.rcParams["figure.figsize"] = [7.00, 3.50]
plt.rcParams["figure.autolayout"] = True
x = np.linspace(-2, 2, 10)
y = 2**x
plt.plot(x, y)
plt.title('$Y=2^{X}$')
plt.xlabel('$X_{data}$')
plt.ylabel('$Y_{data}$')
plt.show()
輸出

更新於: 08-05-2021
1K+ 瀏覽量

廣告