
 資料結構
資料結構 網路
網路 關係資料庫管理系統
 作業系統
作業系統 Java
Java iOS
iOS HTML
HTML CSS
CSS Android
 Python
 C 程式設計
 C++
C++ C#
C# MongoDB
 MySQL
MySQL Javascript
 PHP
PHP在 Matplotlib 中等效於 matlab 的 imagesc
為了建立等效的 imagesc,我們可以使用範圍 [left, right, bottom, top]。
步驟
- 使用 numpy 建立隨機資料。
- 將資料顯示為影像,即,在帶有 data 和範圍 [−1, 1, −1, 1] 引數的二維常規柵格上。
- 要顯示圖形,使用 show() 方法。
示例
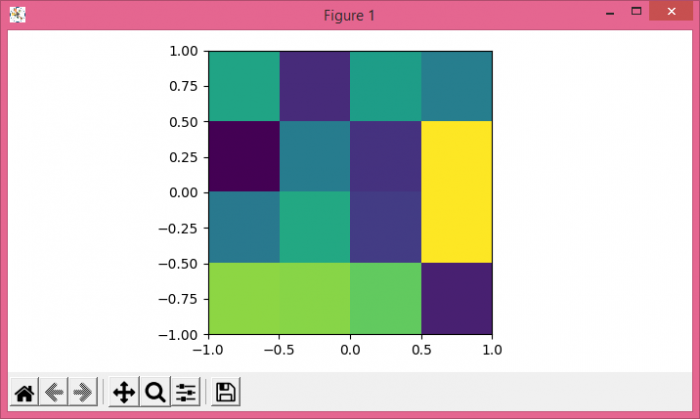
import numpy as np
from matplotlib import pyplot as plt
plt.rcParams["figure.figsize"] = [7.00, 3.50]
plt.rcParams["figure.autolayout"] = True
data = np.random.rand(4, 4)
plt.imshow(data, extent=[-1, 1, -1, 1])
plt.show()
輸出

更新於:06-5-2021
3K+ 瀏覽量

廣告