
 資料結構
資料結構 網路
網路 關係型資料庫管理系統
 作業系統
作業系統 Java
Java iOS
iOS HTML
HTML CSS
CSS Android
 Python
 C 程式設計
 C++
C++ C#
C# MongoDB
 MySQL
MySQL Javascript
 PHP
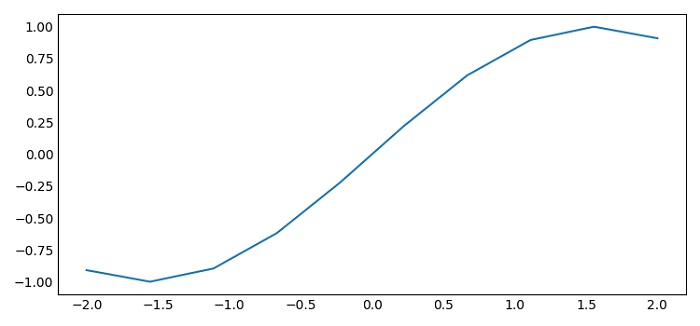
PHP在 Matplotlib 中關閉左/下軸刻度標記
要關閉 matplotlib 中左或下軸刻度標記,我們可以對軸使用length=0。
步驟
設定圖形大小並調整子圖之間和周圍的間距。
使用 numpy 建立 x 和 y 資料點。
使用plot()方法繪製 x 和 y 資料點。
使用帶有length=0的tick_params()方法。
要顯示圖形,請使用show()方法。
示例
import numpy as np
import matplotlib.pyplot as plt

plt.rcParams["figure.figsize"] = [7.50, 3.50]
plt.rcParams["figure.autolayout"] = True

x = np.linspace(-2, 2, 10)
y = np.sin(x)

plt.plot(x, y)
plt.tick_params(axis='both', which='both', length=0)

plt.show()
輸出

更新於: 2021 年 6 月 3 日
467 次瀏覽

廣告