
 資料結構
資料結構 網路
網路 RDBMS
RDBMS 作業系統
作業系統 Java
Java iOS
iOS HTML
HTML CSS
CSS Android
 Python
 C 語言
C 語言 C++
C++ C#
C# MongoDB
 MySQL
MySQL Javascript
 PHP
PHP使用 matplotlib 刪除或調整圖例的邊框
要刪除或調整圖例邊框,我們可以遵循以下步驟:
使用 `plt.xlabel()` 方法設定 X 軸標籤。
使用 `plt.ylabel()` 方法設定 Y 軸標籤。
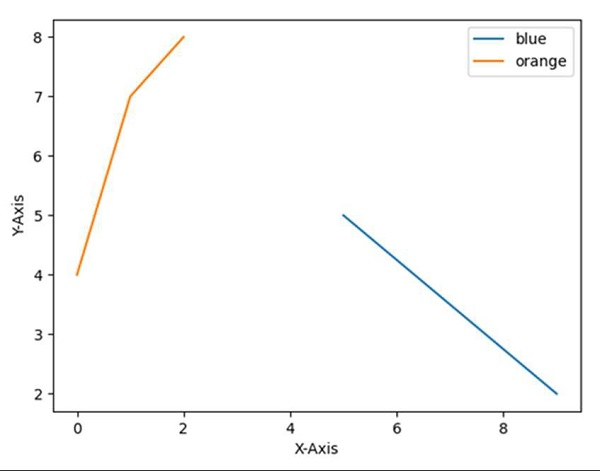
使用 `plt.plot()` 方法繪製線條,並使用陣列 [9, 5]、[2, 5] 和 [4, 7, 8]。
初始化兩個變數:最佳位置 `location = 0`,圖例邊框邊框繪製標誌 `border_drawn_flag = True`(為 `True` 表示為圖例繪製邊框,為 `False` 表示不為圖例繪製邊框)。
使用 `plt.legend()` 方法建立圖例,並相應設定 `location` 和 `border_drawn_flag`,以在圖表中獲取完美的圖例。
`plt.show()` 方法可幫助顯示該圖形。
示例
import matplotlib.pyplot as plt

plt.ylabel("Y-axis ")
plt.xlabel("X-axis ")

plt.plot([9, 5], [2, 5], [4, 7, 8])

location = 0       # For the best location
border_drawn_flag = True
plt.legend(["blue", "orange"], loc=0, frameon=border_drawn_flag)

plt.show()
輸出

更新時間:2021 年 3 月 15 日
2K+ 次瀏覽

廣告