
 資料結構
資料結構 網路
網路 RDBMS
RDBMS 作業系統
作業系統 Java
Java iOS
iOS HTML
HTML CSS
CSS Android
 Python
 C 程式設計
 C++
C++ C#
C# MongoDB
 MySQL
MySQL Javascript
 PHP
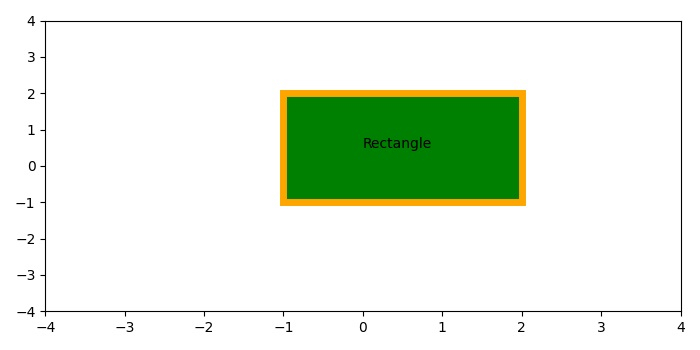
PHP使用 Matplotlib 繪製帶有邊框顏色的矩形
要在 matplotlib 中為矩形設定邊框顏色,我們可以按以下步驟操作:
使用 figure() 方法建立新圖形或啟用現有圖形。
向當前軸新增 subplot 方法。
使用 edgecolor 和邊的 linewidth 建立 Rectangle() 類的一個矩形例項。
在繪圖中新增矩形路徑。
要將文字置於矩形中,我們可以使用 text() 方法。
使用 xlim() 和 ylim() 方法縮放 x 和 y 軸。
要顯示圖形,請使用 show() 方法。
示例
import matplotlib
from matplotlib import pyplot as plt, patches
plt.rcParams["figure.figsize"] = [7.00, 3.50]
plt.rcParams["figure.autolayout"] = True
fig = plt.figure()
ax = fig.add_subplot(111)
rect = matplotlib.patches.Rectangle((-1, -1), 3, 3, edgecolor='orange', facecolor="green", linewidth=5)
ax.add_patch(rect)
plt.text(0, 0.5, "Rectangle")
plt.xlim([-4, 4])
plt.ylim([-4, 4])
plt.show()
輸出

更新於:15-5-2021
2K+ 閱覽量

廣告