
 資料結構
資料結構 網路
網路 RDBMS
RDBMS 作業系統
作業系統 Java
Java iOS
iOS HTML
HTML CSS
CSS Android
 Python
 C 程式設計
 C++
C++ C#
C# MongoDB
 MySQL
MySQL Javascript
 PHP
PHPPython 的 Matplotlib.pyplot 中 3D 引數曲線的線條顏色
要在 Matplotlib 中繪製 3D 引數曲線的線顏色,我們可以採取以下步驟:-
設定圖形大小並調整子圖之間和周圍的內邊距。
使用figure()方法建立一個新圖形或啟用現有圖形。
將一個軸作為子圖排列新增。
要製作引數曲線,請初始化theta、z、r、x 和y變數。
使用scatter()方法繪製x、y和z資料點。
設定繪圖的標題。
要顯示圖形,請使用show()方法。
示例
import numpy as np
import matplotlib.pyplot as plt
plt.rcParams["figure.figsize"] = [7.50, 3.50]
plt.rcParams["figure.autolayout"] = True
fig = plt.figure()
ax = fig.add_subplot(projection='3d')
theta = np.linspace(-4 * np.pi, 4 * np.pi, 100)
z = np.linspace(-2, 2, 100)
r = z ** 2 + 1
x = r * np.sin(theta)
y = r * np.cos(theta)
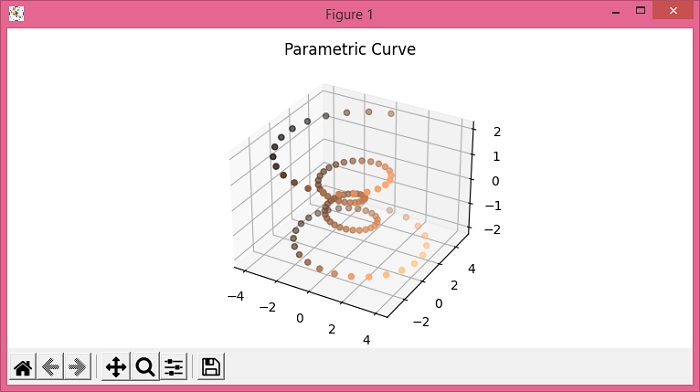
ax.scatter(x, y, z, c=x, cmap="copper")
ax.set_title("Parametric Curve")
plt.show()輸出

更新於:03-Jun-2021
335 次瀏覽

廣告