
 資料結構
資料結構 網路
網路 關係型資料庫管理系統
 作業系統
作業系統 Java
Java iOS
iOS HTML
HTML CSS
CSS Android
 Python
 C 語言程式設計
 C++
C++ C#
C# MongoDB
 MySQL
MySQL Javascript
 PHP
PHP怎樣縮小圖片的部分割槽域並在 Matplotlib 中插入到同一張圖中?
若要放大圖片的一部分並插入到同一張圖中,我們可以按如下步驟操作:
使用 numpy 建立 x 和 y 點。
若要放大圖片的一部分,我們可以在那個範圍內製作 x 和 y 點的資料。
使用 plot() 方法、設定 lw=2、顏色為紅色和標籤,繪製 x 和 y 點(第 1 步)。
使用 legend() 方法,為影像放置文字,主曲線。
透過放置矩形的座標,使用 axes() 方法建立軸線。
使用 plot() 方法、設定 lw=1、顏色為綠色和標籤,繪製 x 和 y 點(第 2 步),即影像的一部分。
使用 legend() 方法,為影像放置文字,放大後的曲線。
使用 show() 方法,顯示影像。
示例
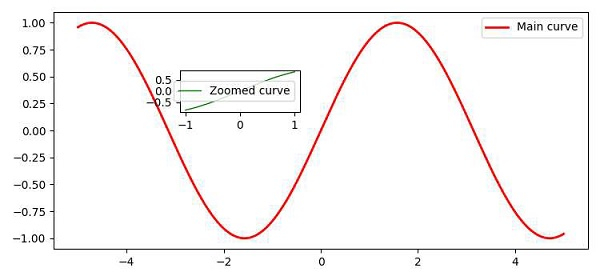
import numpy as np
from matplotlib import pyplot as plt
plt.rcParams["figure.figsize"] = [7.50, 3.50]
plt.rcParams["figure.autolayout"] = True
x = np.linspace(-5, 5, 1000)
y = np.sin(x)
x_zoom = np.linspace(-1, 1, 50)
y_zoom = np.sin(x_zoom)
plt.plot(x, y, c='red', lw=2, label="Main curve")
plt.legend()
axes = plt.axes([.30, .6, .20, .15])
axes.plot(x_zoom, y_zoom, c='green', lw=1, label="Zoomed curve")
axes.legend()
plt.show()
輸出

更新於: 09-04-2021
4 千次 + 瀏覽量

廣告