
 資料結構
資料結構 網路
網路 關係型資料庫管理系統
 作業系統
作業系統 Java
Java iOS
iOS HTML
HTML CSS
CSS Android
 Python
 C 程式設計
 C++
C++ C#
C# MongoDB
 MySQL
MySQL Javascript
 PHP
PHP如何在 Tkinter 畫布上更新繪圖?
建立互動式和動態繪圖是使用 Python 開發圖形使用者介面 (GUI) 的一個重要方面。Tkinter 是 Python 的標準 GUI 工具包,它提供了一個 Canvas 小部件,可以方便地繪製各種形狀,包括繪圖。
在本文中,我們將探討在 Tkinter 畫布上動態更新繪圖的細節。瞭解此過程對於構建具有即時資料視覺化的響應式和使用者友好型應用程式至關重要。
設定畫布
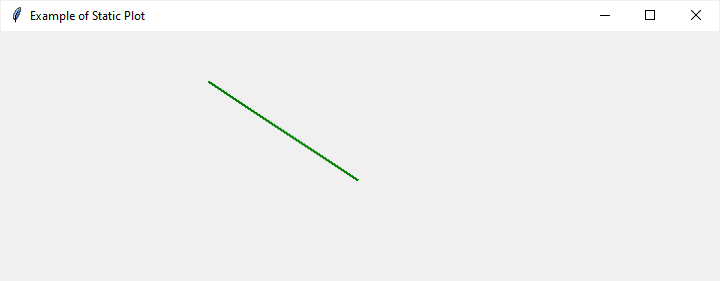
在深入研究動態更新之前,讓我們透過建立一個簡單的 Tkinter 畫布並繪製一個靜態繪圖來建立基礎。Canvas 小部件是允許我們顯示和操作圖形的關鍵元素。以下是一個繪製折線圖的基本示例:
示例
import tkinter as tk

# Create the main Tkinter window
root = tk.Tk()
root.title("Example of Static Plot")
# Set window dimensions
root.geometry("720x250")

# Create a Canvas widget
canvas = tk.Canvas(root, width=400, height=200)
canvas.pack()

# Coordinates for a simple line plot
x1, y1 = 50, 50
x2, y2 = 200, 150

# Create a line on the canvas
line = canvas.create_line(x1, y1, x2, y2, fill="green", width=2)

# Start the Tkinter event loop
root.mainloop()
以上程式碼設定了一個帶有畫布的 Tkinter 視窗,並在其上繪製了一個靜態折線圖。瞭解如何建立靜態繪圖對於我們接下來的示例至關重要。
輸出
在本節中,我們將看到三個不同的 Tkinter 畫布繪圖更新示例。
更新繪圖座標
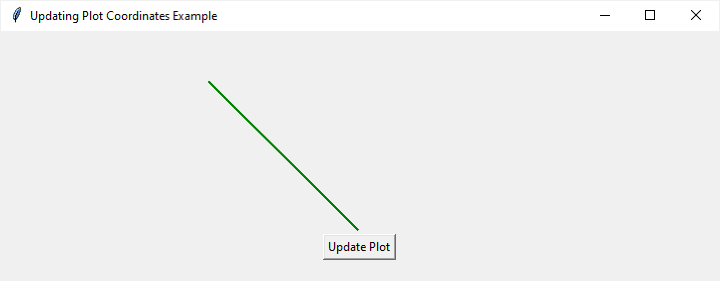
要動態更新繪圖,我們需要一種機制來在執行時修改其座標。canvas.coords 方法允許我們更改畫布上專案的座標。讓我們擴充套件之前的示例,包括一個在按下時更新繪圖的按鈕:
示例
import tkinter as tk

def update_plot():
   # Update the coordinates of the line
   canvas.coords(line, 10, 10, x2, y2)

   # Change the color of the line
   canvas.itemconfig(line, fill="red")

# Create the main Tkinter window
root = tk.Tk()
root.title("Updating Plot Coordinates Example")
# Set window dimensions
root.geometry("720x250")

# Create a Canvas widget
canvas = tk.Canvas(root, width=400, height=200)
canvas.pack()

# Initial coordinates of the line
x1, y1 = 50, 50
x2, y2 = 200, 200

# Create a line on the canvas
line = canvas.create_line(x1, y1, x2, y2, fill="green", width=2)

# Create a button to trigger the update
update_button = tk.Button(root, text="Update Plot", command=update_plot)
update_button.pack()

# Start the Tkinter event loop
root.mainloop()
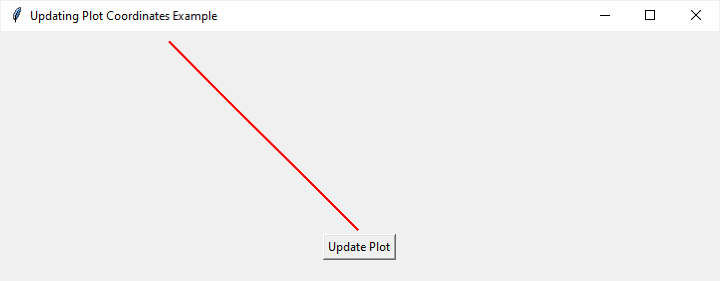
在此示例中,當按下“更新繪圖”按鈕時,會呼叫 update_plot 函式。它利用 canvas.coords 修改線條的座標,有效地更新了繪圖。此外,canvas.itemconfig 用於更改線條的顏色。
輸出
單擊“更新繪圖”按鈕後,它將如下更改繪圖
動畫繪圖
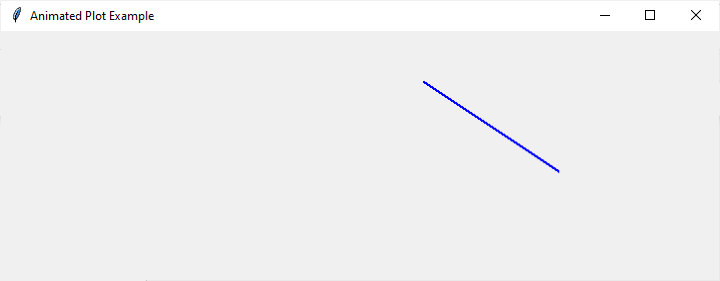
為了創造更具吸引力的使用者體驗,我們可以為繪圖更新引入動畫。Tkinter 提供了 after 方法,允許我們安排一個函式在指定時間後被呼叫。我們可以利用它來建立一個簡單的動畫,其中繪圖逐漸在畫布上移動:
示例
import tkinter as tk

def animate_plot():
   global x1, y1, x2, y2

   # Update the coordinates of the line
   canvas.coords(line, x1, y1, x2, y2)

   # Increment the x-coordinates for animation
   x1 += 5
   x2 += 5

   # Schedule the next animation frame
   canvas.after(50, animate_plot)

root = tk.Tk()
root.title("Animated Plot Example")
root.geometry("720x250")

canvas = tk.Canvas(root, width=400, height=200)
canvas.pack()

x1, y1 = 50, 50
x2, y2 = 200, 150

line = canvas.create_line(x1, y1, x2, y2, fill="blue", width=2)
animate_plot()
root.mainloop()
在此示例中,animate_plot 函式會重複呼叫,每次呼叫之間延遲 50 毫秒,從而產生流暢的動畫效果。在每一幀中,線條的 x 座標都會遞增,導致繪圖在畫布上水平移動。
輸出
更新條形圖
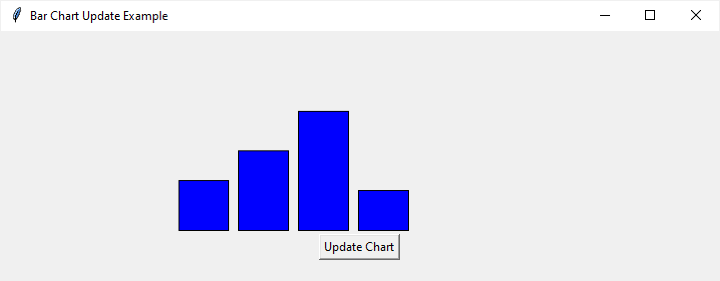
雖然前面的示例側重於折線圖,但更新其他型別的繪圖(例如條形圖)也遵循類似的方法。讓我們建立一個帶有條形圖的示例,其中單擊按鈕會更新條形的高度:
示例
import tkinter as tk
import random

def update_chart():
   # Update the heights of the bars with random values
   for i in range(len(bars)):
      new_height = random.randint(10, 150)
      x1, y1, x2, y2 = canvas.coords(bars[i])
      canvas.coords(bars[i], x1, 200 - new_height, x2, 200)

   # Change the color of the bars
   for bar in bars:
      canvas.itemconfig(bar, fill="green")

# Create the main Tkinter window
root = tk.Tk()
root.title("Bar Chart Update Example")
# Set window dimensions
root.geometry("720x250")

# Create a Canvas widget
canvas = tk.Canvas(root, width=400, height=200)
canvas.pack()

# Initial data for the bar chart
bar_data = [50, 80, 120, 40]

# Create bars on the canvas
bars = []
bar_width = 50
for i, height in enumerate(bar_data):
   x1 = i * (bar_width + 10) + 20
   y1 = 200 - height
   x2 = x1 + bar_width
   y2 = 200
   bar = canvas.create_rectangle(x1, y1, x2, y2, fill="blue")
   bars.append(bar)

# Create a button to trigger the update
update_button = tk.Button(root, text="Update Chart", command=update_chart)
update_button.pack()

# Start the Tkinter event loop
root.mainloop()
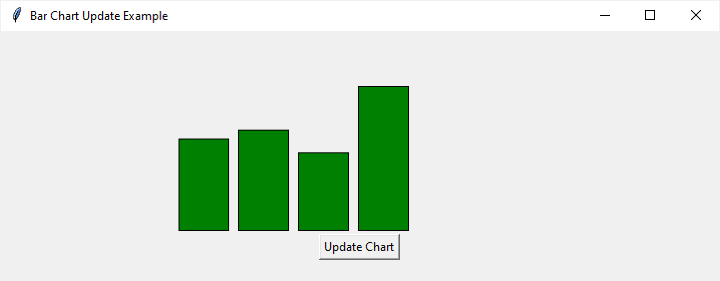
在此示例中,update_chart 函式遍歷每個條形,使用隨機值更新其高度。然後,canvas.itemconfig 方法用於將每個條形更改為綠色。
輸出
單擊“更新圖表”按鈕後,它將如下更改圖表:
結論
掌握在 Python 中的 Tkinter 畫布上動態更新繪圖是一項寶貴的技能,可用於構建互動式和視覺上吸引人的應用程式。我們已經探討了更新繪圖座標、建立動畫以及更新不同型別繪圖(如折線圖和條形圖)的基本概念。
擁有這些知識,開發人員可以透過提供即時資料視覺化和建立響應式 GUI 來增強使用者體驗。隨著您繼續使用 Tkinter 和畫布,嘗試這些概念將為更高階和更復雜的圖形應用程式開啟大門。

2K+ 次檢視
