
 資料結構
資料結構 網路
網路 關係資料庫管理系統
 作業系統
作業系統 Java
Java iOS
iOS HTML
HTML CSS
CSS Android
 Python
 C 程式設計
 C++
C++ C#
C# MongoDB
 MySQL
MySQL Javascript
 PHP
PHP如何使用 Python 繪製兩個並排的圖形?
使用 subplot(row, col, index) 方法,我們可以將圖形分割成 row*col 個部分,並在索引位置繪製圖形。在下面的程式中,我們將在一個圖形中建立兩個圖表。
步驟
使用 numpy 建立 x、y1、y2 點。
使用 subplot() 方法,在當前圖形中新增子圖,其中 nrows = 1,ncols = 2,index = 1。
使用 plot() 方法,使用 x 和 y1 點繪製線條。
使用 plt.title()、plt.xlabel() 和 plt.ylabel() 方法,為圖 1 設定標題以及 X 軸和 Y 軸的標籤。
使用 subplot() 方法,在當前圖形中新增子圖,其中 nrows = 1,ncols = 2,index = 2。
使用 plot() 方法,使用 x 和 y2 點繪製線條。
使用 plt.title()、plt.xlabel() 和 plt.ylabel() 方法,為圖 2 設定標題以及 X 軸和 Y 軸的標籤。
要顯示圖形,請使用 plt.show() 方法。
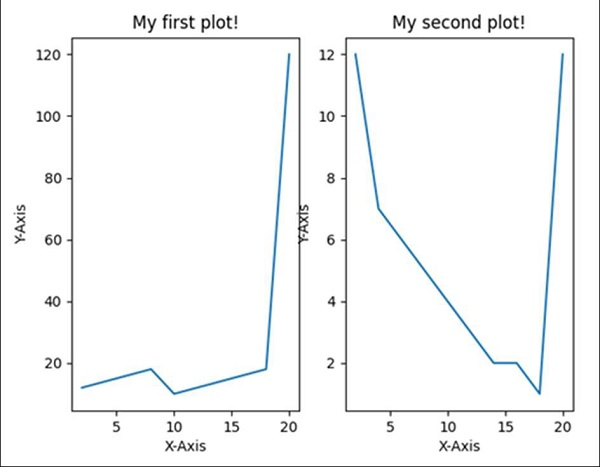
示例
from matplotlib import pyplot as plt
import numpy as np

xPoints = np.array([2, 4, 6, 8, 10, 12, 14, 16, 18, 20])
y1Points = np.array([12, 14, 16, 18, 10, 12, 14, 16, 18, 120])
y2Points = np.array([12, 7, 6, 5, 4, 3, 2, 2, 1, 12])

plt.subplot(1, 2, 1) # row 1, col 2 index 1
plt.plot(xPoints, y1Points)
plt.title("My first plot!")
plt.xlabel('X-axis ')
plt.ylabel('Y-axis ')

plt.subplot(1, 2, 2) # index 2
plt.plot(xPoints, y2Points)
plt.title("My second plot!")
plt.xlabel('X-axis ')
plt.ylabel('Y-axis ')

plt.show()
輸出
瞭解更多:Matplotlib 教程,Python 教程

更新於: 2023-08-27
31K+ 次檢視

廣告