
 資料結構
資料結構 網路
網路 關係型資料庫管理系統
 作業系統
作業系統 Java
Java iOS
iOS HTML
HTML CSS
CSS Android
 Python
 C 程式設計
 C++
C++ C#
C# MongoDB
 MySQL
MySQL JavaScript
 PHP
PHP如何使用 Matplotlib 來限制在 Seaborn 計數圖中顯示的分組數量?
要限制在 Seaborn 計數圖中顯示的分組數量,我們可以使用變數 group_count,在 countplot() 方法的引數中使用。
步驟
建立一個 figure 和兩組子圖。
使用 Pandas 建立一個具有兩個鍵的資料幀。
初始化一個變數 group_count 來限制 countplot() 方法中的分組計數。
使用 countplot() 方法來顯示使用條形圖在各個分類箱中觀測到的計數。
調整子圖之間和周圍的間距。
示例
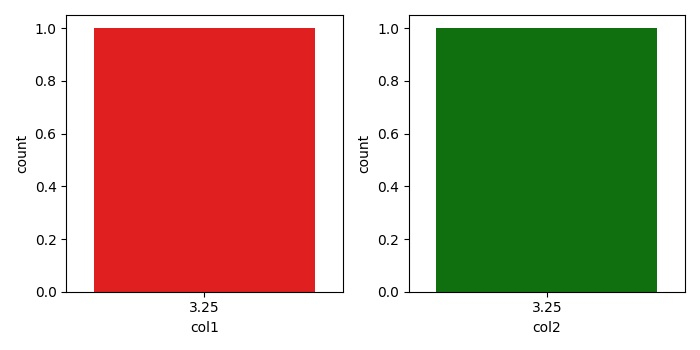
import pandas as pd
import numpy as np
import seaborn as sns
from matplotlib import pyplot as plt
plt.rcParams["figure.figsize"] = [7.00, 3.50]
plt.rcParams["figure.autolayout"] = True
f, axes = plt.subplots(1, 2)
df = pd.DataFrame(dict(col1=np.linspace(1, 10, 5), col2=np.linspace(1, 10, 5), col3=np.linspace(1, 10, 5)))
group_count = 1
sns.countplot(df.col1, x='col1', color="red", ax=axes[0], order=df.col1.value_counts().iloc[:group_count].index)
sns.countplot(df.col2, x="col2", color="green", ax=axes[1], order=df.col2.value_counts().iloc[:group_count].index)
plt.tight_layout()
plt.show()
輸出

更新日期:2021-05-15
1K+ 檢視

廣告