
 資料結構
資料結構 網路
網路 RDBMS
RDBMS 作業系統
作業系統 Java
Java iOS
iOS HTML
HTML CSS
CSS Android
 Python
 C 語言程式設計
 C++
C++ C#
C# MongoDB
 MySQL
MySQL JavaScript
 PHP
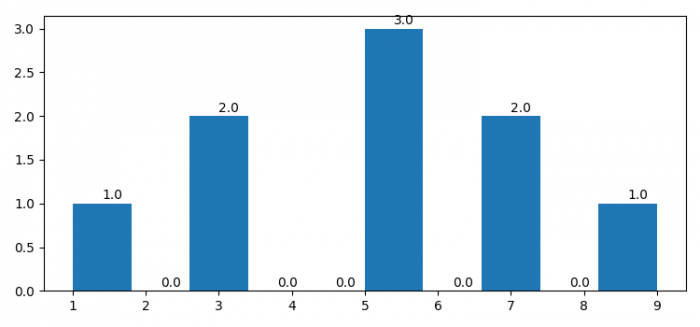
PHP如何在 Matplotlib 直方圖中顯示柱形圖上面的計數?
要在 matplotlib 直方圖中顯示柱形圖上面的計數,我們可以迭代每個圖塊並使用 text() 方法在圖塊上面放置值。
步驟
- 設定圖形大小並調整子圖之間的和周圍的填充。
- 列出一個數字列表以繪製直方圖。
- 使用 hist() 方法繪製直方圖。
- 迭代圖塊並計算每個圖塊的中值和高度以放置文字。
- 使用 show() 方法顯示圖形。
示例
import matplotlib.pyplot as plt

plt.rcParams["figure.figsize"] = [7.50, 3.50]
plt.rcParams["figure.autolayout"] = True

data = [3, 5, 1, 7, 9, 5, 3, 7, 5]
_, _, patches = plt.hist(data, align="mid")

for pp in patches:
   x = (pp._x0 + pp._x1)/2
   y = pp._y1 + 0.05
   plt.text(x, y, pp._y1)

plt.show()
輸出

更新日期:15-06-2021
3K+ 瀏覽量

廣告