
 資料結構
資料結構 網路
網路 RDBMS
RDBMS 作業系統
作業系統 Java
Java iOS
iOS HTML
HTML CSS
CSS Android
 Python
 C 程式設計
 C++
C++ C#
C# MongoDB
 MySQL
MySQL Javascript
 PHP
PHP如何在 R 中使用 ggplot2 建立一個分組圖形,其中一個分組顯示所有資料?
要在 R 中使用 ggplot2 建立一個分組圖形,其中一個分組顯示所有資料,我們可以按照以下步驟操作 -
- 首先,建立一個數據框。
- 然後,使用 facet_grid 函式建立分組圖形。
- 之後,建立一個分組圖形,將 margins 引數設定為 TRUE,以便顯示包含所有資料在內的圖形。
建立資料框
讓我們建立一個如下所示的資料框 -
x<-round(rexp(25,1.25),2)
y<-round(rexp(25,1.89),2)
Grp<-sample(LETTERS[1:3],25,replace=TRUE)
df<-data.frame(x,y,Grp)
df
執行上述指令碼時,將生成以下輸出(由於隨機化的原因,此輸出在你的系統中可能有所不同) -
x y Grp
1 2.32 0.47 C
2 0.96 0.01 C
3 0.34 0.49 A
4 1.11 0.75 C
5 0.57 0.63 C
6 0.47 0.38 B
7 0.69 0.06 A
8 1.12 1.66 C
9 0.62 0.81 C
10 0.05 0.60 C
11 0.50 0.05 A
12 0.06 0.18 A
13 0.08 1.30 C
14 2.22 0.13 C
15 0.03 0.13 C
16 0.06 0.24 C
17 0.57 1.04 A
18 0.50 0.09 C
19 1.10 0.36 B
20 0.10 0.00 B
21 1.28 0.42 A
22 1.56 0.34 A
23 1.38 0.15 A
24 0.54 0.03 B
25 1.81 1.85 A
建立分組圖形
使用 facet_grid 函式在 x 和 y 之間建立一個分組散點圖 -
x<-round(rexp(25,1.25),2)
y<-round(rexp(25,1.89),2)
Grp<-sample(LETTERS[1:3],25,replace=TRUE)
df<-data.frame(x,y,Grp)
library(ggplot2)
ggplot(df,aes(x,y))+geom_point()+facet_grid(~Grp)
輸出
建立顯示一個分組幷包含所有資料的分組圖形
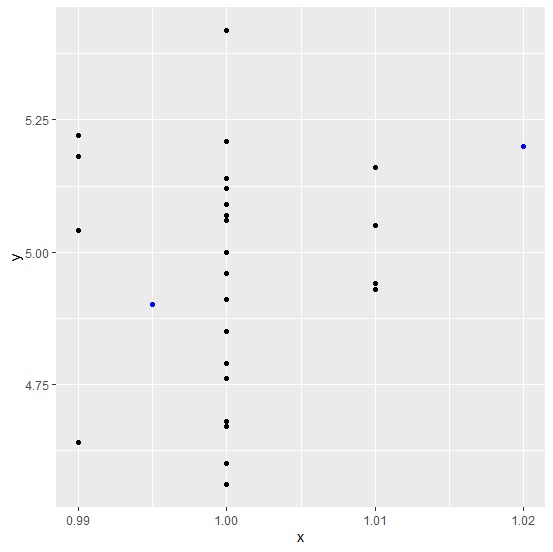
如下所示,使用 margins 引數建立顯示一個分組幷包含所有資料的分組圖形 -
x<-round(rexp(25,1.25),2)
y<-round(rexp(25,1.89),2)
Grp<-sample(LETTERS[1:3],25,replace=TRUE)
df<-data.frame(x,y,Grp)
library(ggplot2)
ggplot(df,aes(x,y))+geom_point()+facet_grid(~Grp,margins=TRUE)
輸出


更新於: 2021 年 8 月 14 日
168 次瀏覽

廣告