
 資料結構
資料結構 網路
網路 關係資料庫管理系統
 作業系統
作業系統 Java
Java iOS
iOS HTML
HTML CSS
CSS Android
 Python
 C 程式設計
 C++
C++ C#
C# MongoDB
 MySQL
MySQL Javascript
 PHP
PHP如何使用 Python 和 openpyxl 在 Excel 中建立圖表?
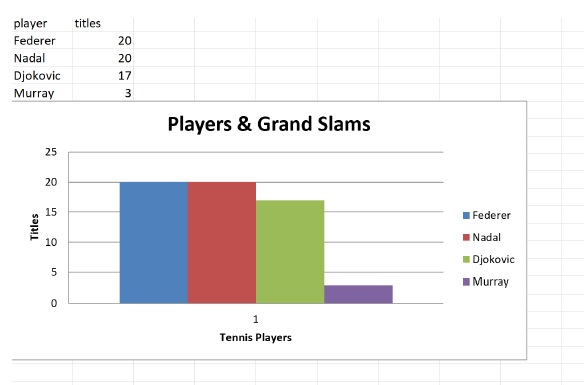
在這篇文章中,我將向您展示如何使用 Python - Openpyxl 模組在 Excel 中建立圖表。我們將從頭開始建立一個 Excel 電子表格,其中使用網球運動員的大滿貫冠軍作為資料,使用 openpyxl 模組建立條形圖。
介紹..
Microsoft Office 從 Office 2007 開始為 Microsoft Excel 電子表格提供了一個新的副檔名 .xlsx,以支援儲存更多行和列。此更改已將 Excel 電子表格遷移到基於 XML 的檔案格式並使用 ZIP 壓縮。Microsoft 電子表格統治著世界,人們一直將電子表格用於各種目的,其中一個用例是用於資料視覺化。
準備就緒..
Python 的 xlrd 模組是 Openpyxl 模組的替代方案,在支援 Excel 格式方面一直表現良好,但是此模組只能對 Excel 電子表格執行讀取操作。openpyxl 模組可以對 Excel 電子表格執行讀寫操作。
如何操作..
1). 讓我們首先使用以下命令安裝 openpyxl 模組
pip install openpyxl.
2). 定義用於建立新 Excel 電子表格的資料。
# import the module
import openpyxl

# Define your file name and data
file_name = "charts.xlsx"
file_data = (['player', 'titles'], ['Federer', 20], ['Nadal', 20], ['Djokovic', 17], ['Murray', 3])
3). 建立一個新的 Excel 檔案。這將建立一個預設工作表,名為 Sheet
xlsxfile = openpyxl.Workbook()
print(f" *** The sheets inside the excel_file are = {xlsxfile.sheetnames}")
new_workbook = xlsxfile['Sheet']
*** The sheets inside the excel_file are = ['Sheet']
4). 將有關網球運動員及其大滿貫冠軍的資料新增到此工作表中。
for row, (player,titles) in enumerate(file_data, 1):
new_workbook['A{}'.format(row)].value = player
new_workbook['B{}'.format(row)].value = titles
5). 最後將資料儲存到 file_name 檔案中
xlsxfile.save(file_name)
6). 將檔案載入到記憶體中並列出所有工作表。請注意,我們僅在步驟 2 中建立了一個工作表。
import openpyxl
excel_file_data = openpyxl.load_workbook(file_name)
excel_file_data.sheetnames
['Sheet']
7). 獲取第一個工作表並獲取單元格的值,例如 A2 和 B2。
sheet_values = excel_file_data['Sheet']
print(f" *** One of the value from the sheet is - {sheet_values['A2'].value} - {sheet_values['B2'].value}")
*** One of the value from the sheet is - Federer - 20
8). 輸出電子表格中的所有行和列,只是為了確保我們已正確插入圖表資料。
for row in sheet_values:
for cell in row:
print(cell.value)
player
titles
Federer
20
Nadal
20
Djokovic
17
Murray
3
9). 從 openpyxl.chart 中匯入 BarChart、Reference 模組並建立 Barchart 物件。
from openpyxl.chart import BarChart, Reference
chart = BarChart()
#10.
# Fill the basic information like chart title,..

chart.title = "Players & Grand Slams"
chart.y_axis.title = 'Titles'
chart.x_axis.title = 'Tennis Players'
#11.
# Now we will create a reference to the data and append the data to the chart.

data = Reference(sheet_values, min_row=2, max_row=5, min_col=1, max_col=2)
chart.add_data(data, from_rows=True, titles_from_data=True)
#12.
# Finally, Add the chart to the sheet and save the file.

new_workbook.add_chart(chart, "A6")
xlsxfile.save(file_name)
步驟 11 透過 Reference 物件建立一個參考框,從第 2 行第 1 列到第 5 行第 2 列,這是我們的資料所在區域,當然不包括標題。
使用 .add_data() 方法將資料新增到圖表中。**from_rows** - 使每一行成為不同的資料系列。**titles_from_data** - 使用第一列為系列命名。
示例
我們將把上面解釋的所有內容放在一起。
"""
Program: Create charts in excel using Python with openpyxl params: NA
output: Creates a chart.xlsx file with tennis players grandslam titles and a barchart representation of the data
"""
# import the module
import openpyxl
# Define your file name and data
file_name = "charts.xlsx"
file_data = ([ 'player' , 'titles' ], [ 'Federer' , 20 ], [ 'Nadal' , 20 ], [ 'Djokovic' , 17 ], [ 'Murray' , 3 ])
# create an excel spreadsheet
xlsxfile = openpyxl . Workbook ()
print ( f " *** The sheets inside the excel_file are = { xlsxfile . sheetnames } " )
new_workbook = xlsxfile [ 'Sheet' ]
for row , ( player , titles ) in enumerate ( file_data , 1 ):
new_workbook [ 'A {} ' . format ( row )] . value = player
new_workbook [ 'B {} ' . format ( row )] . value = titles
# save the spreadsheet
xlsxfile .save ( file_name )
# read the data
 excel_file_data = openpyxl . load_workbook ( file_name )
excel_file_data . sheetnames

sheet_values = excel_file_data [ 'Sheet' ]
print ( f " *** One of the value from the sheet is - { sheet_values [ 'A2' ] . value } - { sheet_values [ 'B2' ] . value } " )
for row in sheet_values :
for cell in row :
print ( cell . value ) # barchart creation from openpyxl.chart
import BarChart , Reference chart = BarChart ()
# Fill the basic information like chart title,..
chart . title = "Players & Grand Slams"
 chart . y_axis . title = 'Titles'
chart . x_axis . title = 'Tennis Players'
# Now we will create a reference to the data and append the data to the chart.
data = Reference ( sheet_values , min_row = 2 , max_row = 5 , min_col = 1 , max_col = 2 )
chart .
 add_data ( data , from_rows = True , titles_from_data = True )
# Finally, Add the chart to the sheet and save the file.
new_workbook . add_chart ( chart , "A6" )
 xlsxfile . save ( file_name )
*** The sheets inside the excel_file are = ['Sheet'] *** One of the value from the sheet is - Federer - 20 player titles Federer 20 Nadal 20 Djokovic 17 Murray 3
輸出
執行上述程式時,將在與程式碼相同的目錄中建立 charts.xlsx,如下所示。

2K+ 次檢視
