
 資料結構
資料結構 網路
網路 關係資料庫管理系統 (RDBMS)
 作業系統
作業系統 Java
Java iOS
iOS HTML
HTML CSS
CSS Android
 Python
 C 程式設計
 C++
C++ C#
C# MongoDB
 MySQL
MySQL Javascript
 PHP
PHP如何在 JavaFX XY 圖表中更改刻度標記的顏色和字型?
javafx.scene.XYChart 類是所有在 xy 平面中繪製的圖表的基礎類。透過例項化此類的子類,您可以建立各種 XY 圖表,例如:線圖、區域圖、條形圖、餅圖、氣泡圖、散點圖等。
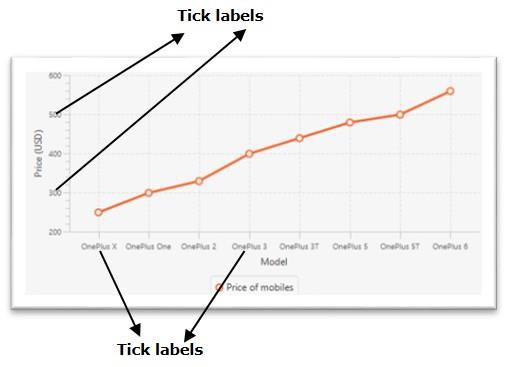
在 XY 圖表中,給定的資料點繪製在 XY 平面上。在 x 軸和 y 軸上,您將有刻度標記和刻度標籤。標籤指定值的名字(或數字)。
更改刻度標籤的顏色
javafx.scene.chart.Axis 類(抽象類)是 XY 圖表中所有軸的基礎類。要建立 X 軸和 Y 軸,您需要例項化這些類的子類。
NumberAxis 類用於建立數值軸,而 CategoryAxis 類用於建立字串類別軸。
Axis 類有兩個屬性:
tickLabelFill - 此屬性指定當前軸中所有刻度標籤的填充顏色。您可以使用 setTickLabelFill() 方法設定此屬性的值。
tickLabelFont - 此屬性指定當前軸中所有刻度標籤的字型。您可以使用 setTickLabelFont() 方法設定此屬性的值。
您可以使用這些方法設定 XY 圖表刻度標籤所需的顏色和字型。
示例
import javafx.application.Application;
import javafx.geometry.Insets;
import javafx.scene.Scene;
import javafx.scene.chart.BubbleChart;
import javafx.stage.Stage;
import javafx.scene.chart.NumberAxis;
import javafx.scene.chart.XYChart;
import javafx.scene.layout.StackPane;
import javafx.scene.paint.Color;
public class BubbleChart_Color extends Application {
   public void start(Stage stage) {
      //Creating X and Y axes
      NumberAxis xAxis = new NumberAxis(0, 90, 10);
      NumberAxis yAxis = new NumberAxis(20, 90, 10);
      //Creating labels to the axes
      xAxis.setLabel("Age");
      yAxis.setLabel("Weight");
      //Creating the Bubble chart
      BubbleChart bubbleChart = new BubbleChart(xAxis, yAxis);
      //Preparing data for bubble chart
      XYChart.Series series = new XYChart.Series();
      series.getData().add(new XYChart.Data(10, 30, 4));
      series.getData().add(new XYChart.Data(25, 40, 5));
      series.getData().add(new XYChart.Data(40, 50, 6));
      series.getData().add(new XYChart.Data(55, 60, 8));
      series.getData().add(new XYChart.Data(70, 70, 9));
      //series.getData().add(new XYChart.Data(85, 80, 12));
      //Setting the data to bar chart
      bubbleChart.getData().add(series);
      //Setting name to the bubble chart
      series.setName("work");
      //Setting color to tick labels
      xAxis.setTickLabelFill(Color.RED);
      yAxis.setTickLabelFill(Color.RED);
      //Creating a stack pane to hold the chart
      StackPane pane = new StackPane(bubbleChart);
      pane.setPadding(new Insets(15, 15, 15, 15));
      pane.setStyle("-fx-background-color: BEIGE");
      //Setting the Scene
      Scene scene = new Scene(pane, 595, 350);
      stage.setTitle("Bubble Chart");
      stage.setScene(scene);
      stage.show();
   }
   public static void main(String args[]){
      launch(args);
   }
}
輸出


更新於:2020年5月20日
636 次瀏覽

廣告