
 資料結構
資料結構 網路
網路 關係型資料庫管理系統
 作業系統
作業系統 Java
Java iOS
iOS HTML
HTML CSS
CSS Android
 Python
 C 程式設計
 C++
C++ C#
C# MongoDB
 MySQL
MySQL Javascript
 PHP
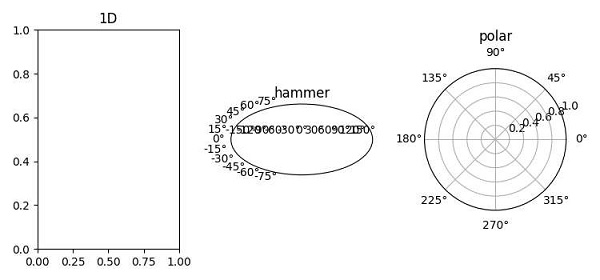
PHP如何更改現有軸的 matplotlib 子圖投影?
雖然更改現有軸的投影看起來很難,但我們可以採用以下步驟來建立不同型別的投影 -
使用 subplot() 方法,向當前圖表新增一個子圖,其中 nrows=1、ncols=3 且當前 index=1。
向當前軸新增一個標題。
使用 subplot() 方法,向當前圖表新增一個子圖,其中 nrows=1、ncols=3 且 current index=2、projection=hammer。
向當前軸新增標題 錘子。
使用 subplot() 方法,向當前圖表新增一個子圖,其中 nrows=1、ncols=3 且 current index=3、projection=polar。
向當前軸新增標題 極座標。
要顯示圖表,請使用 show() 方法。
示例
from matplotlib import pyplot as plt
plt.rcParams["figure.figsize"] = [7.50, 3.50]
plt.rcParams["figure.autolayout"] = True
plt.subplot(131)
plt.title("1D")
plt.subplot(132, projection="hammer")
plt.title("hammer")
plt.subplot(133, projection="polar")
plt.title("polar")
plt.show()
輸出

更新於: 2021 年 4 月 10 日
1K+ 瀏覽次數

廣告